Vibrational Circular Dichroism Spectroscopy—Theory and Practice
If you find any inaccurate information, please let us know by providing your feedback here

Tóm tắt nội dung
- 1. INTRODUCTION
- 2. DEFINITION OF VIBRATIONAL CIRCULAR DICHROISM
- 3. VCD INSTRUMENTATION
- 4. MEASUREMENT OF VCD SPECTRA
- 5. QUALITATIVE AND QUANTITATIVE ANALYSIS
- 6. DETERMINATION OF ABSOLUTE CONFIGURATION
- 7. CALCULATION OF VCD SPECTRA
- 8. COMPARISON OF MEASURED AND CALCULATED SPECTRA
- 9. DETERMINATION OF ENANTIOMERIC EXCESS
- 10. CONCURRENT USE OF VCD FOR ABSOLUTE CONFIGURATION AND EE
- ADDITIONAL SOURCES OF INFORMATION (USP 1-DEC-2024)
This article is compiled based on the United States Pharmacopeia (USP) – 2025 Edition
Issued and maintained by the United States Pharmacopeial Convention (USP)
1 1. INTRODUCTION
Chirality is a ubiquitous aspect of the world of three spatial dimensions. Molecules that possess sufficient structural complexity so that their mirror-image structures are non-superimposable are termed chiral. For chiral pharmaceutical molecules, two important structural measures critical to their physical characterization are absolute configuration (AC) and enantiomeric excess (EE), also termed enantiomeric purity. The AC of a chiral molecule specifies its three-dimensional structure in space and distinguishes it from its mirror-image structure.
Structures related by mirror symmetry are known as “enantiomers”. The AC of a particular enantiomer is critical to its action as a pharmaceutical agent because mirror-image structures, i.e., enantiomers, have different therapeutic effects, both desired and undesired. The EE of a sample specifies, usually as an excess percentage, the relative amounts of enantiomers. An EE of 100% is a pure enantiomer (100% enantiomeric purity), 0% is a racemic mixture with equal amounts of enantiomers and no excess, and −100% specifies a pure sample of the opposite enantiomer with respect to the EE definition.
The principal chapter that addresses molecular chirality in the USP–NF is Optical Rotation 〈781〉. The optical rotation (OR) of a sample is the measure of the angle of rotation of a plane of polarized light by a chiral sample at a particular wavelength, typically in the visible or near- UV region. The AC and EE of any sample are determined by a measure of its OR if the measurement has been previously calibrated using a sample of known AC and EE. The sign of the OR determines the larger enantiomer amount, and the magnitude of the OR determines the EE, where 100% EE corresponds to the maximum OR possible for the chiral molecule under consideration. Although OR is a simple, well established method for determining AC and EE relative to their known calibrations, not all molecules have measurable OR, particularly with limited sample quantities in which the presence of chiral impurities cannot be determined by an OR measurement. The OR is simply a number with no structural information about the sample molecule.
In the past several decades, the AC of an unknown chiral molecule has been determined using the Bijvoet method of single-crystal X-ray crystallography. The Bijvoet method requires a single high-purity crystal of the molecule with a single chiral phase. Analysis by this method is not always possible, for example, for noncrystallizable liquids or insoluble solids, and in many cases analysis using the Bijvoet method requires lengthy efforts and time to achieve crystallization.
This chapter presents a technique for the determination of AC that relies on vibrational circular dichroism (VCD), a procedure that is now widely used throughout the pharmaceutical industry for chiral molecules for which the AC is unknown. The technique involves comparing the measured VCD spectrum for a chiral molecule to the quantum chemistry calculation for the same molecule. If the measured and calculated VCD spectra show agreement on the principal features and their signs, this means that the AC of the physical sample is the same as the AC of the structure used in the calculation. If the signs are opposite, the AC of the sample is the opposite of that used in the calculation.
As described below, statistical methods have been developed for assessing the degree of confidence that the AC has been correctly determined by the VCD method. Usually the AC of a chiral molecule is specified by connecting its structural chirality, labeled with R or S for chiral centers or P or M for chiral axes, to the sign of its measured OR as (+) or (−). Once the AC of a molecule has been determined by VCD, for example, (S)-(−)-α-pinene, its VCD spectrum can become a reference standard of the AC of this molecule, and the AC of any subsequent sample of this molecule can be determined by comparison to its VCD reference standard. An important advantage of determining AC by VCD is the spectral richness of a VCD spectrum that supports the simultaneous determination of the structural identity of the molecule and its absolute chirality. In contrast to OR, every chiral molecule has a VCD spectrum, because all molecules have infrared (IR) absorption bands, each one of which acts as a chromophore for a VCD spectrum. VCD also is sensitive to molecular conformations. As demonstrated below, information about the conformation of a chiral molecule is obtained as a bonus from the VCD determination of AC, but AC is the principal informational content of chiral pharmaceutical molecules. An extensive body of literature describing the AC of biological molecules has been created during the past 30 years and can be used as a basis for determining secondary and higher-order structural states of biological drug substances. Stereospecific methods using VCD can be developed to characterize the production, formulation, and stability of biopharmaceutical products.
This chapter also presents a method for the determination of EE using VCD. EE determination with VCD takes advantage of the fact that the magnitude of a VCD spectrum, measured as the circular polarization absorbance difference for a constant parent IR absorbance spectrum, is directly proportional to EE with no offset. Thus, the maximum relative size of a VCD spectrum is obtained for an EE of 100%, is zero for an EE of 0% (racemic mixture), and is maximum with opposite signs (all positive VCD bands are negative and all negative VCD bands are positive) for an EE of −100%. The advantage of VCD EE determination is that the EE of any molecular sample can be determined by a single VCD measurement once the relative size of VCD for 100% EE (or any %EE value) is known for that molecule. Separation of enantiomers with chiral chromatography is not needed.
2 2. DEFINITION OF VIBRATIONAL CIRCULAR DICHROISM
VCD is defined as:
ΔA = AL − AR
ΔA = the difference in the IR absorbance
AL = sample absorbance A for left circularly polarized (LCP) radiation
AR = sample absorbance A for right circularly polarized (RCP) radiation
Unpolarized IR absorbance intensity is defined as the average of LCP and RCP intensities:
A = (AL + AR)/2
The IR intensities of enantiomers are identical, whereas enantiomers have equal and opposite-signed VCD intensities.
3 3. VCD INSTRUMENTATION
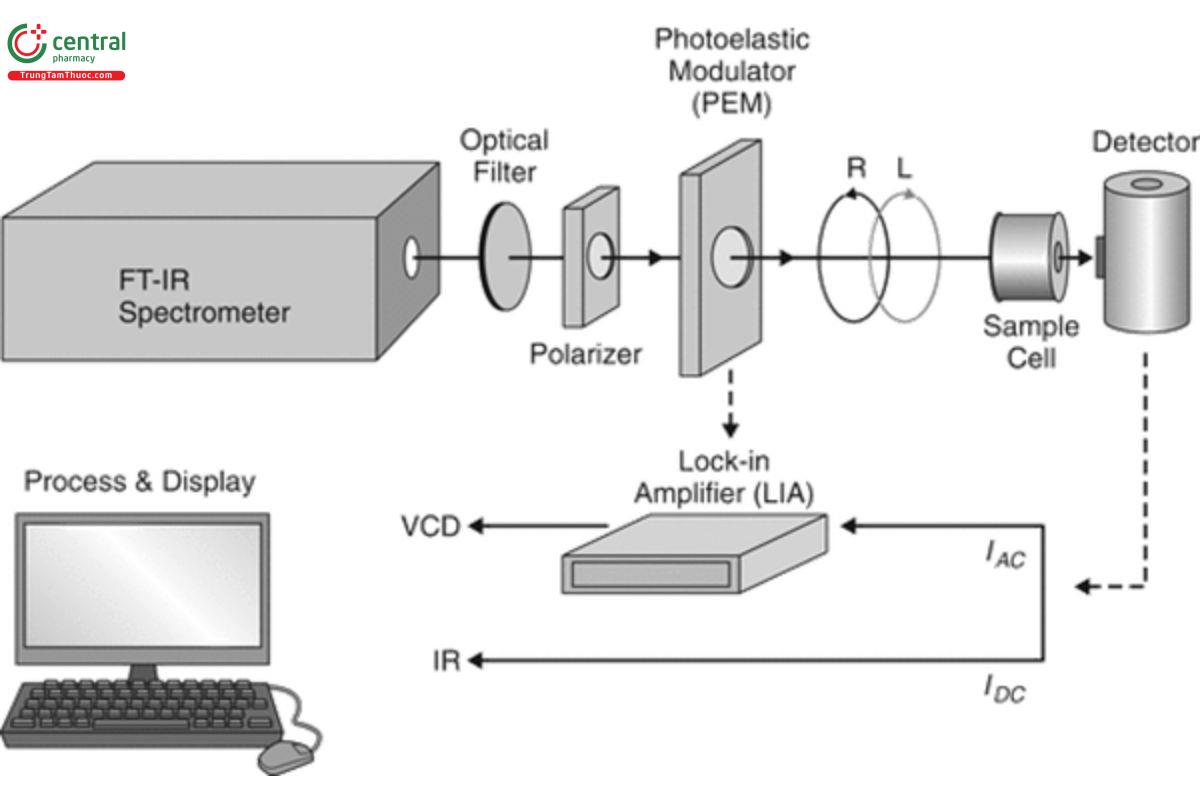
The measurement of a VCD spectrum and its parent mid-IR spectrum is based on Fourier transform-IR (FT-IR) absorption spectroscopy. The optical–electronic layout for the measurement of VCD using an FT-VCD spectrometer is illustrated in Figure 1. The output beam of an FT- IR spectrometer is optically filtered and then linearly polarized before passage through a photoelastic modulator (PEM). The zinc selenide (ZnSe) PEM, typically used for VCD measurement, changes the polarization state of the beam between LCP and RCP at a frequency of 37 kHz. A sample solution in a standard IR cell is placed in the beam, and a liquid nitrogen-cooled detector of mercury–cadmium telluride (MCT) detects the transmitted beam. The detector produces signals in two frequency ranges: 1) I , in the range of 1–2 kHz, represents the FT-IR interferogram; and 2) I , centered at 37 kHz, represents the FT-VCD interferogram. The FT-IR interferogram may be directly Fourier-
transformed to yield the IR spectrum. After synchronous demodulation (using a lock-in amplifier or purely numerical processing) with a reference at 37 kHz, the VCD interferogram can be Fourier-transformed to yield the VCD spectrum. Both the IR and VCD spectra are presented in dimensionless absorbance units, A, and hence the ratio of the VCD to the IR intensity for any band in the spectrum yields the dimensionless anisotropy ratio for that vibrational transition. Figure 1 illustrates the minimum setup for VCD measurement, but technically advanced instruments use two PEMs to increase baseline stability and two sources to increase signal quality or reduce sample measurement time. Measurement of VCD in other spectral regions, for example the hydrogen-stretching or near-IR, can be carried out with appropriate changes in sources, polarizers, filters, PEM, cells, and detectors.
Change to read:
4 4. MEASUREMENT OF VCD SPECTRA
Figure 2 shows the IR and VCD spectra for (+)-R- and (−)-S-α-pinene as a neat liquid measured at 4 cm−1 spectral resolution for 1 h. Also shown are the stereostructures of the two opposite enantiomers (+)-R- and (−)-S-α-pinene. This figure shows that the IR spectra are nearly identical (superimposed dash and solid traces) for these enantiomers and that IR is therefore blind to chirality. By contrast, the corresponding VCD spectra have intensities that are equal in magnitude with opposite signs for each band in the spectrum. The two stereostructures for α-pinene are presented in a form that makes clear their mirror symmetry, and it follows that mirror-symmetric pairs of chiral molecules have mirror-symmetric VCD spectra about the zero baseline. The VCD baseline for these spectra is offset slightly above zero and can be baseline corrected as discussed below. Inspection of the intensity scales for the IR and VCD spectra reveals that the VCD intensities are approximately four orders of magnitude smaller than the corresponding IR intensities. Finally, each band in the IR spectrum has a corresponding VCD band. The richness of the resolved spectral bands in the VCD spectrum, each one representing what has traditionally been called a chromophore in electronic circular dichroism (ECD), gives VCD its exceptional combination of structural richness and stereochemical specificity.
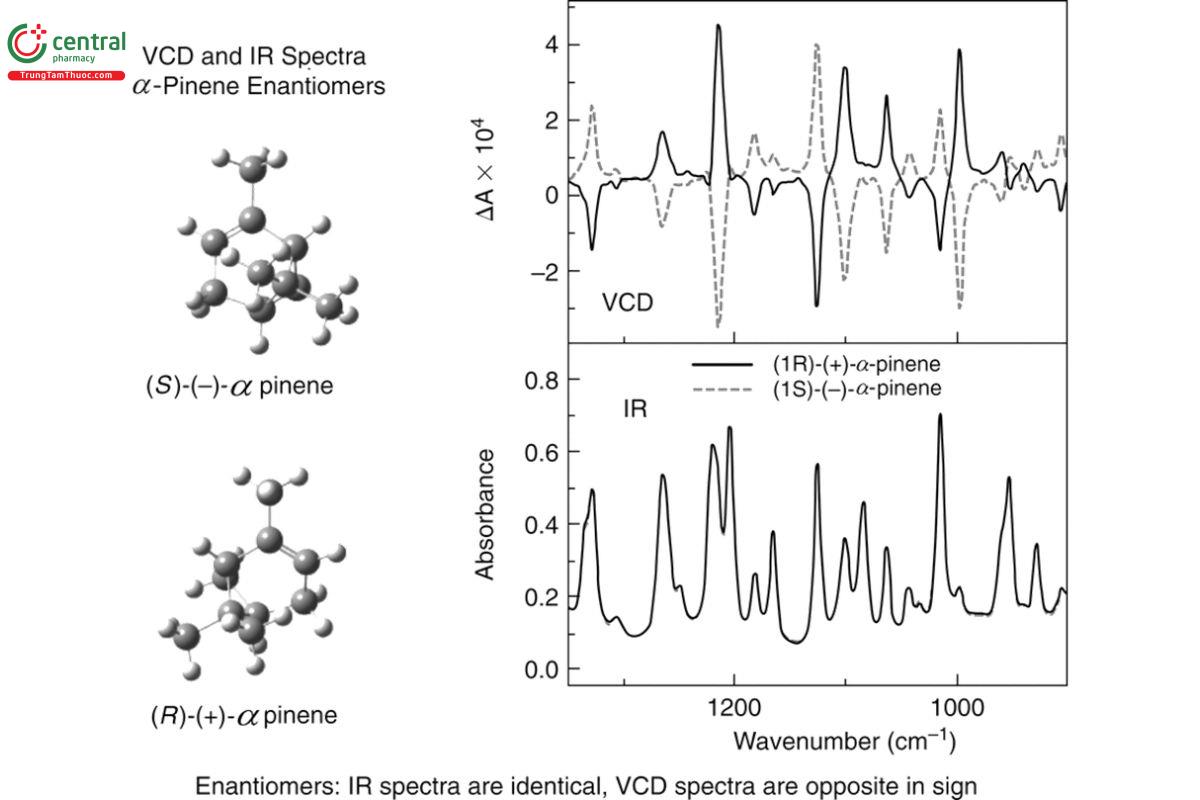
Sampling requirements for VCD are similar to those needed to obtain a good IR spectrum. Ideally, as shown in Figure 2, analysts choose a combination of path length and sample concentration to obtain an average IR absorbance value A in the range between 0.2 and 0.8 and concentrations between 0.1 and 1.0 M, depending on the molecular weight of the sample. Typical path lengths for organic solvents are in the range of 50–100 µm, and sample quantities needed are typically 5–10 mg, although amounts as small as 2 mg are possible. Typical solvents for VCD measurement of organic molecules are deuterated solvents that have reduced solvent absorption in the mid-IR region. Besides hydrogen-free solvents, such as carbon tetrachloride (CCl ), other commonly used and less-toxic (USP 1-Dec-2024) solvents for VCD are deuterated chloroform (CDCl ) and deuterated Dimethyl sulfoxide (DMSO-d).
IR and VCD spectra can be plotted either in absorbance units, as A and ΔA, that reflect the sampling conditions, or in molar absorption coefficients, ε and Δε, that remove the concentration and path-length dependence of the intensity to give a molecular-level property that can be compared quantitatively to calculated IR and VCD intensities. The conversion between these two sets of quantities is given by:
A = ϵC × l
A = IR absorbance
ε = molar absorption coefficient C = concentration (mol/L)
l = path length (cm)
and
ΔA = ΔϵC × l
ΔA = difference in the IR absorbance
Δε = difference in molar absorption coefficient
A useful dimensionless measure of the intrinsic strength of a VCD band is the anisotropy ratio, defined as g = ΔA/A = Δε/ε. Including the spectral frequency dependence of IR and VCD, the measured spectra are expressed respectively either as A(ν) and ΔA(ν) or as ε(ν) and Δε(ν).
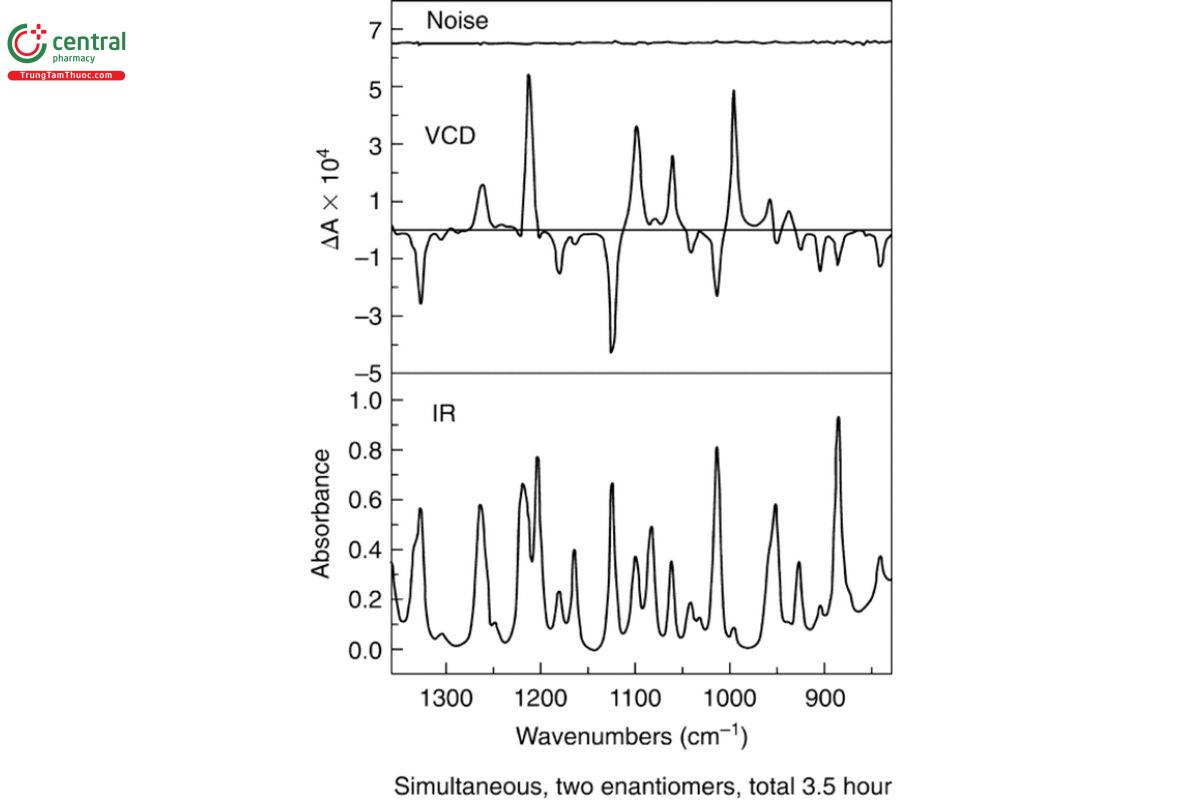
VCD spectra require baseline corrections for instrumentation and solvent intensity. Deviations from a perfectly flat baseline with zero offset must be removed before a final calibrated VCD spectrum is complete. Solvent baseline correction can be achieved for VCD spectra by subtraction of the VCD spectrum of the solvent in the same sample cell. If the opposite enantiomer or racemic mixture of the sample is available, baseline correction can be achieved as one-half the difference between these two equal and opposite VCD spectra in the case of enantiomers or as simple subtraction in the case of the racemic mixture. Baseline deviations are caused by the unavoidable presence of linear birefringence in the optical elements of the instrument and the sample cell that can become important for all but the largest VCD intensities. An example of a baseline-corrected VCD spectrum is presented in Figure 3, along with the corresponding IR and VCD noise spectrum. The spectrum of this sample of neat (−)-(S)-α-pinene was collected for a period of 1 h at 4 cm−1 spectral resolution in a (USP 1-Dec-2024) barium fluoride (BaF ) cell (USP 1-Dec-2024) with a path length of 75 µm. The noise spectrum is less than 1 × 10⁻⁵ absorbance (A) units across the spectrum. The IR, VCD, and noise spectra presented in Figure 3 may be taken as a validation standard for the performance of a mid-IR FT-VCD instrument, as described in Vibrational Circular Dichroism Spectroscopy 〈782〉.
Change to read:
5 5. QUALITATIVE AND QUANTITATIVE ANALYSIS
5.1 5.1 Ensure That Signs and Intensities Are Correct
Qualitative analysis can be carried out with VCD by comparing the VCD spectrum of an unknown to a reference spectrum of that molecule to identify common features and to confirm that the VCD spectrum of the sample is a close match to the reference spectrum.
Quantitative analysis using VCD involves measuring the VCD intensity of the sample molecule and comparing it to a standard reference spectrum for that molecule. In this way, the concentration and the %EE of the sample can be determined as follows. The intensity of the IR spectrum relative to the IR standard of the sample determines the concentration for measurements with the same path length. After normalizing the IR intensity of the unknown sample to the standard, the relative intensities of the VCD determine the %EE of the sample. Such comparisons need to be carried out with all sampling conditions being the same, including the solvent and instrument spectral resolution.
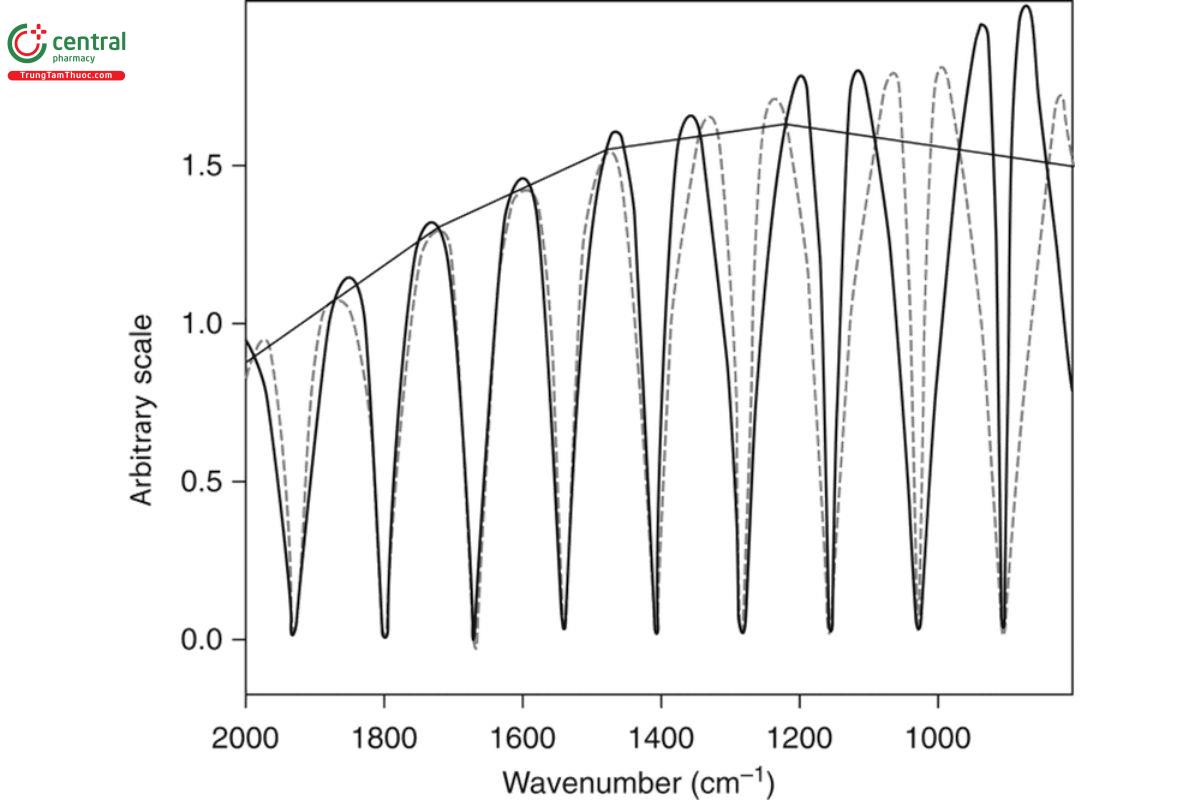
To determine that the VCD intensities are correct, the uncalibrated VCD intensities must be calibrated. This is accomplished by placing a multiple-wave plate in the sample position, followed by a polarizer that is either parallel or perpendicular to the instrument polarizer in Figure
1. Measurement of the VCD spectrum of this multiple-wave plate setup for two settings of the wave plate and polarizer that differ by 90° produces two sets of curves that have crossing points. The curve connecting the crossing points follows the shape of a first-order Bessel function and represents unit VCD intensity. Dividing this curve into the uncalibrated VCD spectrum produces a VCD spectrum with the correct calibrated intensities. The two calibration curves and their crossing-point curve are illustrated in Figure 4.
5.2 5.2 Determination of the Noise Level at Each Point in the Spectrum
A critical factor in quantitative analysis using VCD is the degree of accuracy of the spectrum as given by the VCD noise level and baseline stability of the measurement. The noise level depends on a number of factors such as the D* value of the detector, the amount of radiation passing through the sample from the source, and the amount of absorption of the sample. The noise level is obtained by dividing the VCD measurement into two halves. Addition of these halves gives the VCD spectrum, including noise, whereas subtraction eliminates the VCD features and leaves the equivalent noise spectrum. An example of a VCD noise spectrum is given in Figure 3, which shows, from bottom to top, the IR, VCD, and VCD noise spectra for a measurement of (−)-S-α-pinene. The VCD noise level can be reduced by increasing the measurement time through co-addition of the spectra, as desired.
5.3 5.3 VCD Baseline Accuracy
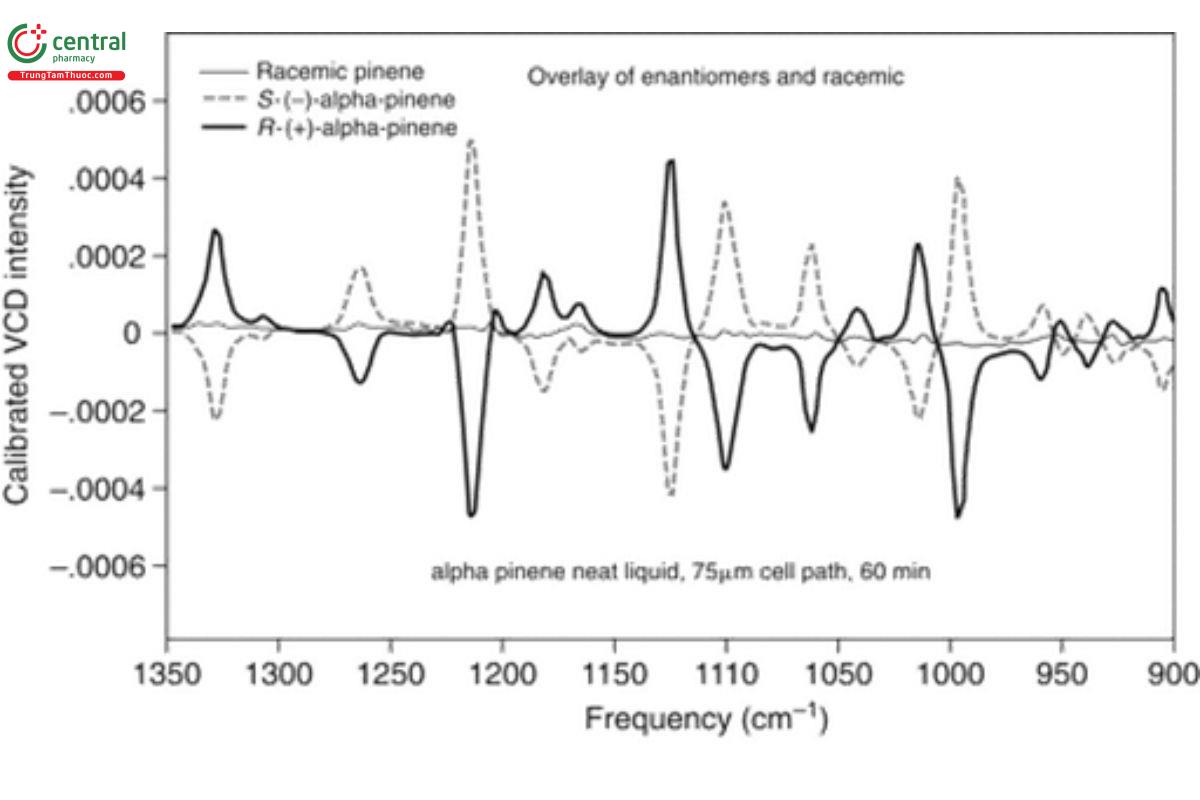
A second critical factor in the measurement of a VCD spectrum is the characteristics of the VCD baseline, namely its location, straightness, and stability. The VCD zero intensity line between positive and negative VCD intensities needs to lie as close as possible to the electronic zero of the measurement (zero of spectral display). Due to the sensitivity of the VCD intensity scale, some offset of the baseline from electronic zero almost always occurs, as discussed above in reference to the need for baseline correction of the VCD spectra of α- pinene in Figure 2 and as carried out for Figure 3. Use of α-pinene as a validation standard is advantageous, because α-pinene has an unusually large intensity and thus, its spectrum is relatively easy to measure on a regular basis. α-Pinene can also be used as a measure of the baseline of a VCD measurement relative to the electronic zero of the measurement. This is illustrated in Figure 5, where the VCD spectra of (−)-α-pinene (dash) and (+)-α-pinene (black) are presented along with the VCD spectrum of a racemic mixture [equal quantities of (−)-α- pinene and (+)-α-pinene, hence canceling the VCD intensity] of α-pinene (gray). The VCD spectrum of the racemic mixture of α-pinene is the VCD baseline for this measurement. A typical standard for baseline quality is deviations from electronic zero of <10% of the maximum separation of positive and negative VCD intensity of the neat α-pinene spectrum, or approximately 1 × 10⁻⁴. The baseline illustrated in Figure 5 satisfies this standard to within 5%. The baseline at 1350 cm−1 is slightly above electronic zero and has maximum excursions away from electronic zero of <0.00005, or 5 × 10⁻⁵ at 1170 cm−1, which can be compared to the maximum positive and negative intensity values of (−)- α-pinene of +5 × 10⁻⁴ at 1220 cm−1 and a negative peak value of −4 × 10⁻⁴ at 1130 cm−1.
5.4 5.4 VCD Baseline Absorption Artifacts and Single-Enantiomer Measurement Capability
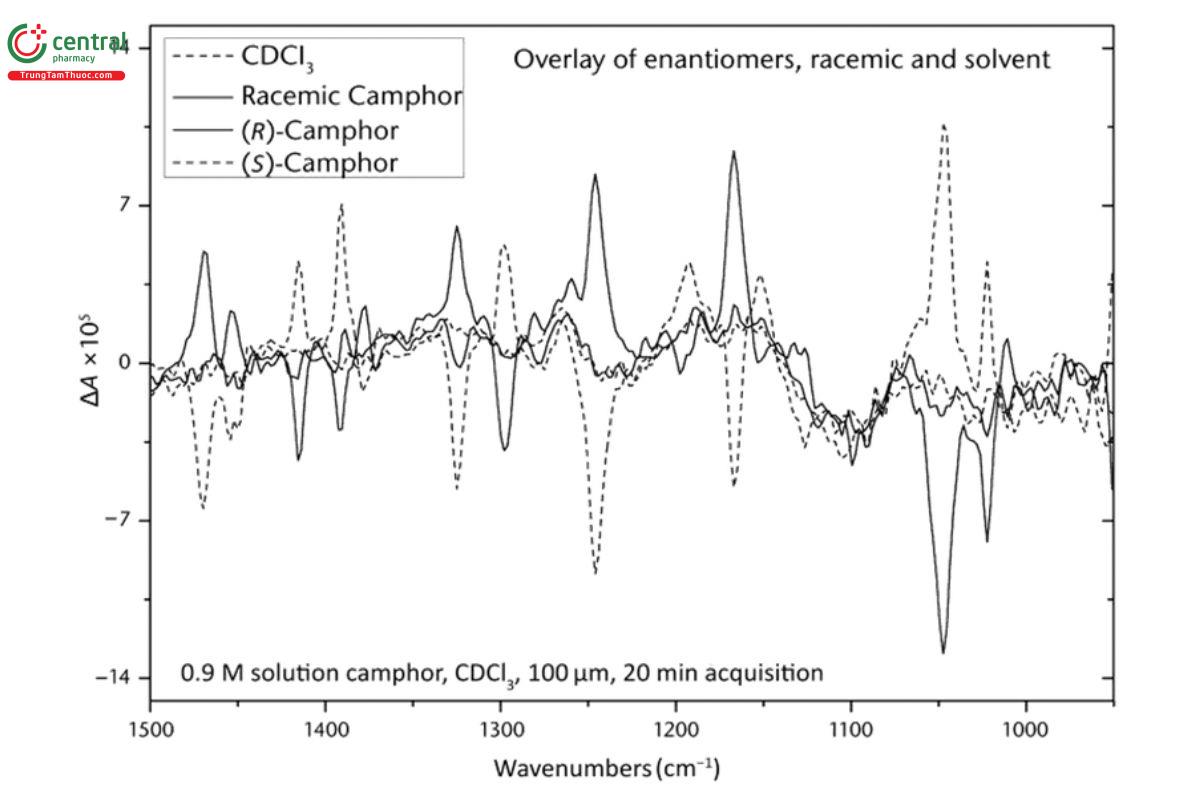
For tests of baseline accuracy and stability, the sample Camphor in deuterated chloroform (USP 1-Dec-2024) solution is used as a qualification standard and provides a more stringent test than α-pinene, because the VCD spectrum of camphor is approximately one-fifth the magnitude, relative to the IR absorbance spectrum, of that of neat α-pinene. The VCD spectra of both enantiomers, as well as two measures of the VCD baseline, are provided in Figure 6 . It is clear, as in Figure 2 and Figure 5, that the VCD spectra of enantiomers, in this case (+)-camphor and (−)-camphor, are equal in intensity and opposite in sign relative to the VCD baseline to within the noise level of the measurement. The two VCD baselines provided are both zero VCD measurements. The VCD spectrum of racemic camphor [equal mixture of (+)-camphor and (−)-camphor] is the true VCD baseline for the individual (+)-camphor and (−)-camphor spectra, even if there are offsets (artifacts) due to absorption bands in the IR spectrum of camphor. The absence of such artifacts to within the noise level of the measurement is demonstrated by the congruence of the VCD spectrum of the racemic mixture and that of the solvent, deuterated chloroform. (USP 1-Dec-2024) Because deuterated chloroform (USP 1-Dec-2024) has no significant level of absorbance in the region of the spectrum displayed, the agreement of these two baselines within the noise level demonstrates the absence of baseline artifacts in the VCD spectrum of racemic camphor, and therefore, for the VCD measurement of either of the two enantiomers of camphor.
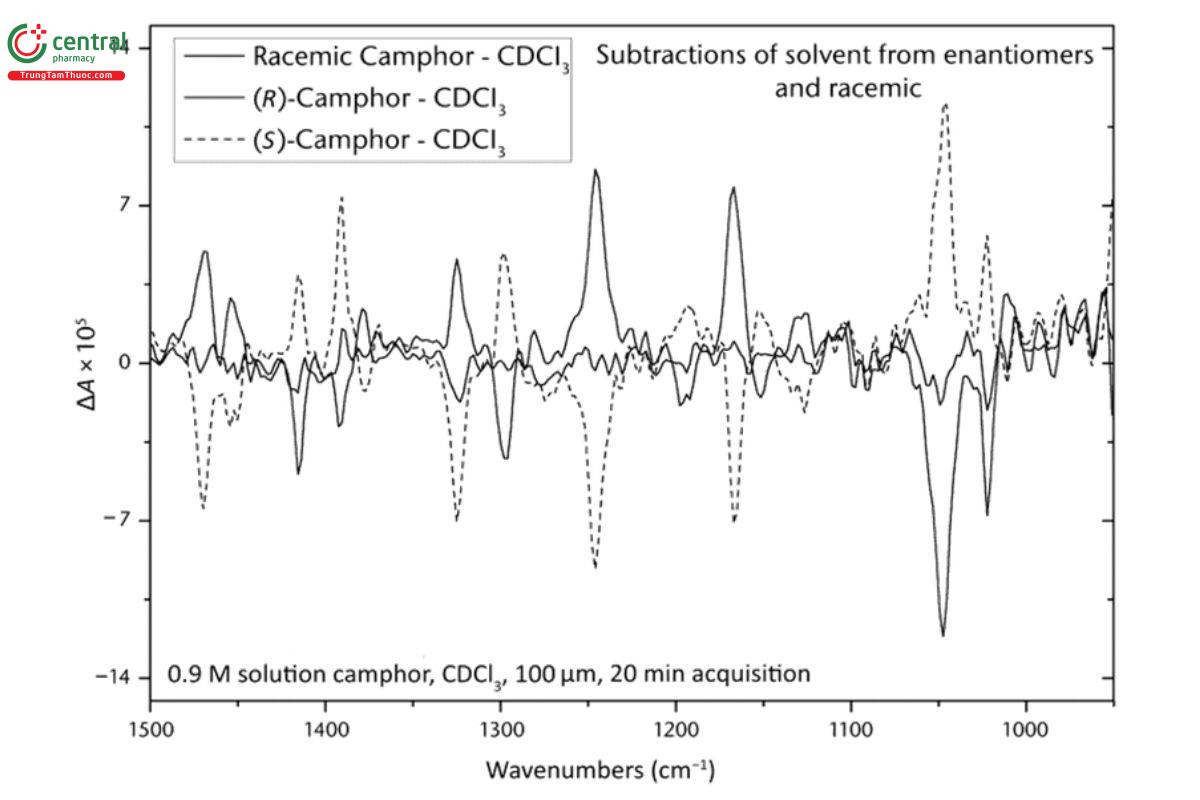
Achieving a VCD baseline that is free of absorption artifacts is usually done by optical alignment of the VCD instrument such that the baseline is as close as possible to the true electronic zero of the instrument of the measurement. In Figure 6 , the VCD baseline can be seen to wander above and below zero across the spectrum, but in this case, the deviations from the electronic zero are small (approximately 2 × 10⁻⁵) and <20% of the positive and negative maximum VCD intensities of the spectrum (approximately 1 × 10⁻⁴). This value of deviation is consistent with the maximum baseline magnitudes discussed above for α-pinene and displayed in Figure 5, because α-pinene has a much larger (approximately 5×) VCD spectrum, relative to its IR spectrum, than camphor. The baselines for camphor in Figure 6 are noisier than that of α-pinene in Figure 5, because the VCD spectrum scale is smaller and the measurement time is 20 min instead of 1 h. As in Figure 3, the VCD baseline can be corrected by subtraction of an appropriate baseline spectrum, racemic or solvent. In Figure 7, the baseline-corrected VCD spectra for both enantiomers and the racemic mixture have been obtained by subtraction of the VCD spectrum of the solvent deuterated chloroform. (USP 1-Dec-2024) As a result, the VCD zero baseline and the instrument electronic zero are the same to within the noise level, and the mirror symmetric properties of these spectra are even more apparent. This VCD test verifies that by subtracting the VCD spectrum of the solvent, an accurate VCD spectrum of camphor can be obtained using only one enantiomer, either the (+)- or (−)-enantiomer, and hence, the instrument possesses a single-enantiomer VCD measurement capability.
(USP 1-Dec-2024)
5.5 5.5 VCD Measurement Stability and Noise Level Reduction
Comparison of VCD measurements of camphor for 20 min to that measured over a period of 4 h in blocks of 20 min permits evaluation of instrument measurement stability as well as the reduction of noise level over time. In Figure 8, 12 such 20-min VCD spectra measured in 4 h are presented to show the stability of a VCD spectrum over time. It is clear that there are no deviations of VCD spectra outside the noise level of any one 20-min spectrum, and hence, there is no long-term drift in the VCD baseline over this time period.
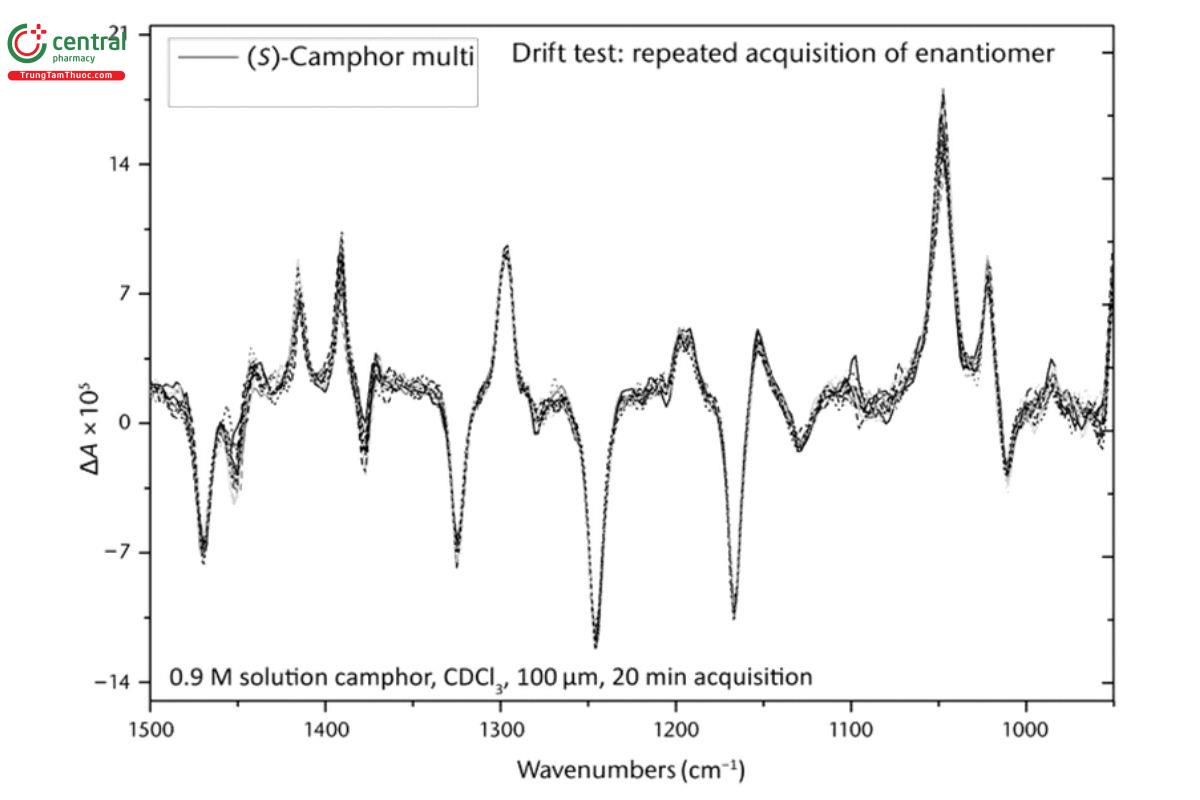
(USP 1-Dec-2024)
If the 12 blocks of 20-min VCD spectra in Figure 8 are averaged, the resulting 4-h VCD spectrum can be compared to a 20-min VCD spectrum of the same sample to demonstrate the noise reduction that is achieved upon signal averaging, provided there are no other systematic noise sources in the VCD spectrometer. In this case, the noise reduction should be a factor of the square root of 12, or approximately 3.5. Thus, the signal-to-noise ratio should improve by a factor of 3.5. Such a comparison is provided in Figure 9 .
![Figure 9. Comparison of the 4-h average of 12 20-min VCD spectra [S-(–)-camphor 240 min (gray)] to one 20-min measurement of camphor [R-(+)-camphor 20 min (black)], under the conditions of Figure 6 , Figure 7, and Figure 8, showing improvement in signal-to-noise ratio with increased collection time.](/images/item/vibrational-circular-dichroism-spectroscopy-theory-and-practice-usp-2025-9.jpg)
The noise level can be visualized directly on a 5× more sensitive scale to better evaluate the noise levels by comparing the noise spectrums, as illustrated and described in Figure 3, for the 4-h and 20-min VCD measurements. This is presented in Figure 10.
![Figure 10. Comparison of the VCD noise spectra of R-(+)-camphor for one 20-min measurement [R-(+)-camphor noise (gray)] versus a 4-h measurement [R-(+)-camphor noise (black)] under the conditions of Figure 6 , Figure 7, Figure 8, and Figure 9 , where the intensity scale has been expanded to accommodate noise spectra that are 5× enlarged for better viewing from the noise levels in the previous four figures.](/images/item/vibrational-circular-dichroism-spectroscopy-theory-and-practice-usp-2025-10.jpg)
(USP 1-Dec-2024)
6 6. DETERMINATION OF ABSOLUTE CONFIGURATION
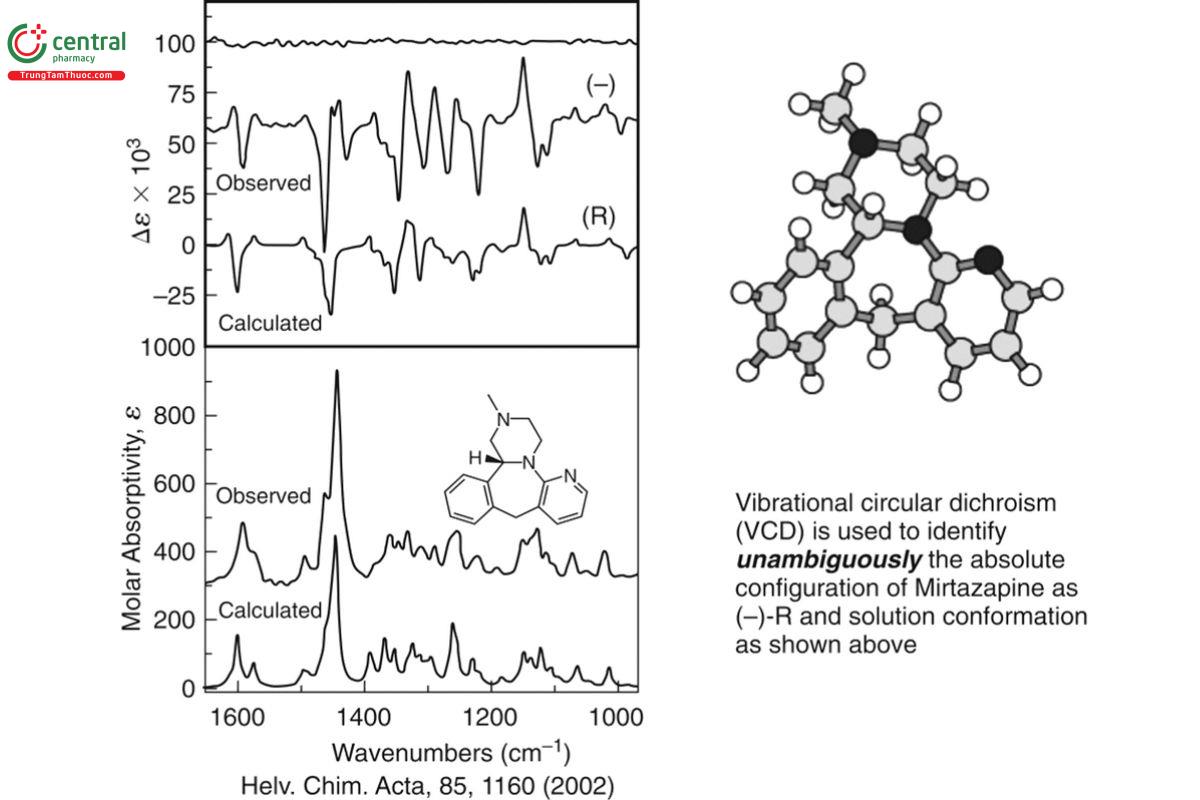
The IR and VCD spectra of a sample are measured in solution in a matter of minutes to hours without the requirement of prior crystallization or high sample optical purity. The AC of an unknown sample is determined by comparison of its measured VCD spectrum to a VCD quantum chemistry calculation of the same molecule, where the AC used in the calculated VCD spectrum is chosen arbitrarily. If the signs of the bands in the measured VCD spectrum match those in the calculated VCD spectrum, the AC of the sample is identical to that used in the calculation. If the signs are opposite, then the sample has the opposite AC compared with that calculated. An example of the determination of the AC of a pharmaceutical molecule is shown in Figure 11. The AC of mirtazapine, which is sold in racemic form, is determined by comparison of the measured IR and VCD spectra of the (−)-enantiomer to the calculated IR and VCD spectra of the R- enantiomer. The close match in VCD signs—vibrational frequencies, intensities of the observed and calculated spectra, and IR frequencies and intensities—demonstrates clearly that the AC of Mirtazapine is (−)-R. Also shown in Figure 11 is the stereospecific quantum chemistry calculated structure of R-mirtazapine.
If the AC of a molecule has previously been established, for example, by X-ray crystallography, a VCD calculation of the molecule is not necessary (but could be performed as a check of the X-ray assignment), and the measured VCD spectrum of the molecule may be taken as a reference standard for the AC of the molecule, supported, for example, by USP. For a molecule with unknown structural chirality, the determination of its AC by VCD requires a comparison of the measured and calculated IR and VCD spectra, ε(ν) and Δε(ν), as shown in Figure 11. The key point of the comparison is correlating the major VCD bands to determine whether they have the same or opposite signs. The IR spectrum is a guide in the process. Seeing a close correspondence between the calculated and measured IR spectra provides confidence that a good vibrational force field has been calculated and the most important vibrational bands are correlated. If a corresponding correlation of the signs of the major VCD bands can be made, as in Figure 11, then the AC has been determined.
When the measured and calculated VCD spectra are compared, the magnitudes of the corresponding intensities are not critical. What is important is the relative intensities of the bands in the two spectra, and in fact, that the comparison of measured and calculated spectra can be made using different sets of intensities for ε(ν) and Δε(ν) for the calculated spectra and A(ν) and ΔA(ν) for the measured spectra. In general, an exact match of the measured and calculated band frequencies is not expected because of several limitations of the calculations. Examples of these limitations include the assumption of the harmonic approximation when some anharmonicity is present in the measured spectra, the need to ignore the effects of solvent interactions with the chiral solute molecule, limitations in the size of the basis set used for the quantum calculation, and the choice of density functional required for the density functional theory (DFT) calculation.
7 7. CALCULATION OF VCD SPECTRA
To determine the AC of a molecule with unknown chirality using the VCD method as an alternative to, or supplement to, X-ray crystallography, analysts conduct a quantum chemistry calculation of the IR and VCD intensities of the molecule. Since the late 1990s, commercial DFT software has been available and can be used effectively by a trained user because it does not require special expertise or extensive experience in quantum chemistry calculations. For example, VCD calculations are now part of some undergraduate chemistry curricula. The following steps are required to perform a DFT calculation of IR and VCD:
1. The stereospecific structure of the molecule is entered through a visual graphics interface.
2. The quantum chemistry program then automatically performs the following steps:
A. The geometry is optimized to a minimum energy conformation.
B. A force field is calculated that determines the vibrational modes of the molecule, with 3N-6 modes for a molecule with N atoms.
C. Atomic polar tensors that yield the IR spectrum are calculated.
D. Atomic axial tensors that yield the VCD spectrum are calculated.
3. The output of the calculation consists of a table where for each mode i there is a frequency, ν , IR intensity (dipole strength), D , and VCD intensity (rotational strength), R .
4. Commercially available programs calculate the IR and VCD spectra for the molecule using the following steps:
A. A line shape, f(ν), is applied to each dipole and rotational strength value, D and R , centered at each vibrational frequency, ν .
B. Summation of these normal mode line-shaped intensities automatically produces the final calculated IR and VCD spectra ε(ν) and Δε(ν) that can be compared directly to the corresponding measured IR and VCD spectra.
Another important factor that often is encountered in the assignment of the AC of pharmaceutical molecules and natural products (because of the structural complexity of these types of molecules) is the presence of more than one important conformer under the measurement conditions. The fractional populations of different conformers can be predicted by using their relative calculated energies in the Boltzmann distribution. The lowest-energy conformer has the highest fractional population and so on, to increasingly less-populated conformers with higher relative energies. To calculate the VCD, one must calculate the IR and VCD of each important conformer and then add these spectra together, weighted by the fractional Boltzmann population. Usually, one can ignore the spectral contributions of conformers that account for less than a few percent of the total population.
Programs for calculating VCD and IR spectra to the level of accuracy sufficient for comparison to measured IR and VCD are available commercially from a variety of sources. First, one needs a program for evaluating and finding the geometry of all the lowest-energy conformations of a chiral molecule. A variety of programs using molecular mechanics are available for this purpose. Second, one needs a full quantum chemistry software program for calculating the ab initio force fields, vibrational frequencies, and VCD and IR intensities for each of the lowest-energy conformers. A common chemical model of sufficient accuracy for AC determination is DFT, using a basis set minimum of 6-31G(d), and a choice of hybrid functionals, such as B3LYP or B3PW91. Higher-level basis sets and alternative choices of hybrid functionals may be made. Finally, one needs a software method for comparing measured and calculated VCD and IR spectra to assess the degree of spectral agreement between the measured and calculated spectra, and hence the level of confidence that the correct assignment of AC has been predicted. Additional details are described below.
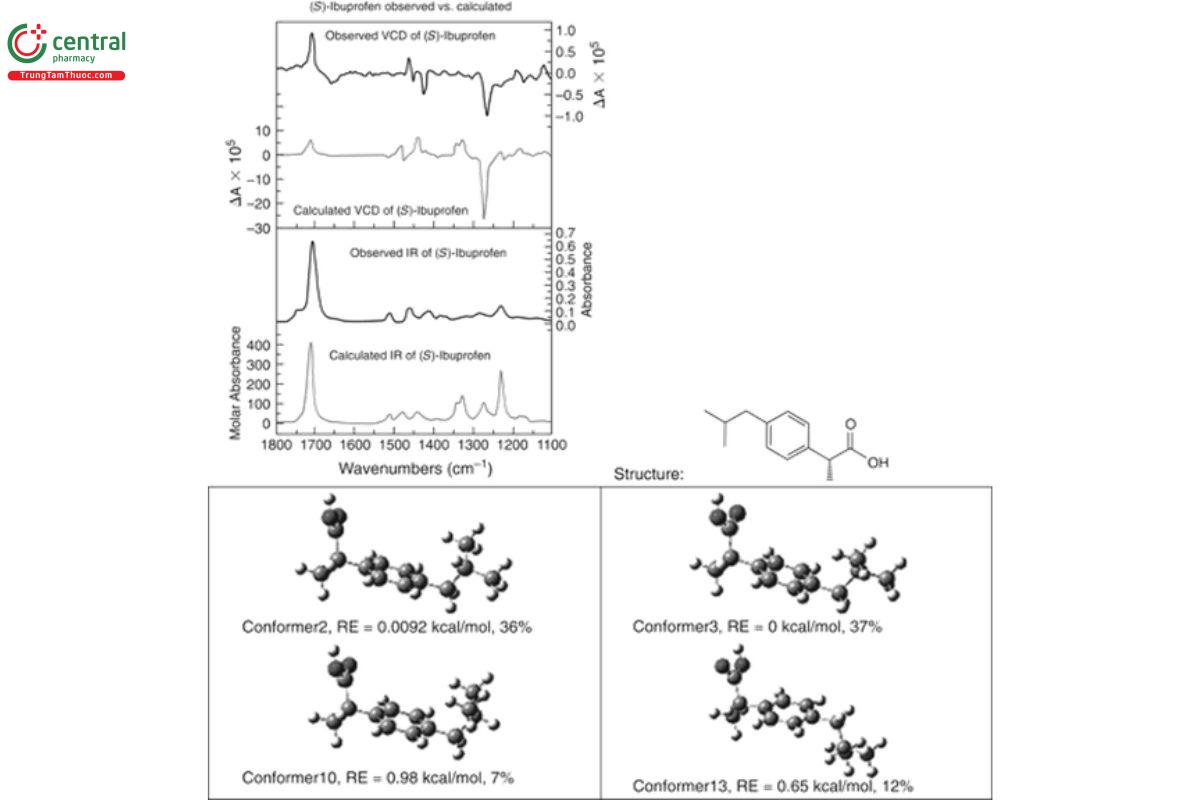
In Figure 12, the AC of the bioactive enantiomer of the analgesic (S)-(+)-ibuprofen is determined by comparing the measured and calculated IR and VCD spectra. The calculated IR and VCD are the sums of the IR and VCD conformer spectra, one for each conformer, weighted by the fractional populations 0.37, 0.36, 0.12, and 0.07, plus smaller contributions from another eight conformers that have a total contribution of 0.08. Clearly, there are two important conformers that are nearly equally populated, and the basic features of the final IR and VCD spectra are determined by these spectra. As a result of this analysis, not only has VCD been able to confirm the AC of (+)-ibuprofen as S, but two dominant solution-state conformers have been identified, along with two additional less-populated conformers.
8 8. COMPARISON OF MEASURED AND CALCULATED SPECTRA
To provide an unbiased statistical measure of the degree of similarity between measured and calculated IR and VCD spectra, an analytical method based on a convolution algorithm has been developed. The degree of similarity, or congruence, between a measured and a calculated spectrum can be calculated and used to determine a degree of confidence that the AC determined by visual inspection is correct.
8.1 8.1 Degree of Confidence of Correct Assignment
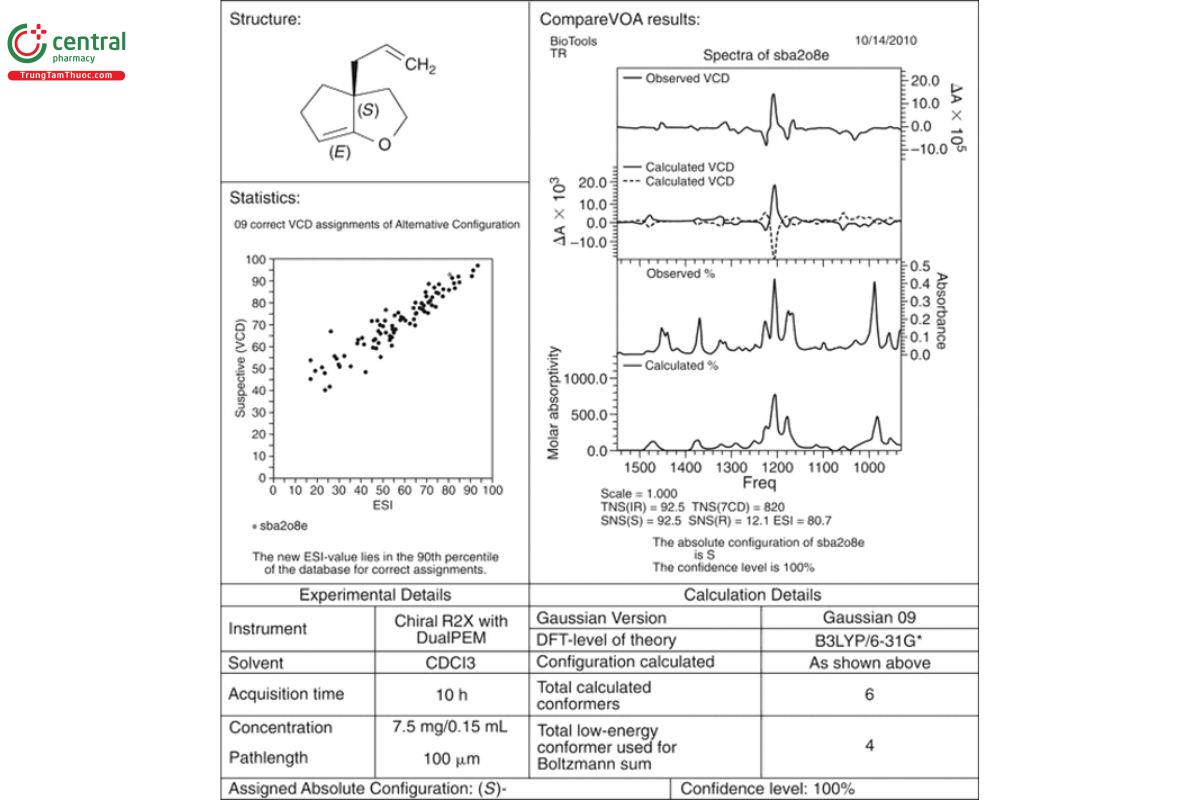
The results of the use of such statistical measures are shown in Figure 13. The degree of similarity (the total neighborhood similarity, TNS) of the measured and calculated IR is 92.5, where 100 is a perfect match. The same TNS measure for the VCD is 82.2. Because VCD bands can be either positive or negative, a more refined analysis is carried out for VCD, and only regions of sign agreement are compared for each enantiomer. In this case, the value of the signed neighborhood similarity (SNS) for the S-enantiomer is 92.8, and for the R-enantiomer, it is only 12.1. Clearly, the analysis confirms the visual agreement of the measured VCD spectrum (upper solid line) and the calculated VCD spectra (lower solid line) for the S-enantiomer versus the R-enantiomer (dashed line). An additional numerical comparison is calculated as the enantiomeric similarity index (ESI), which equals SNS(S) − SNS(R). The result (black dot) is then plotted against a database of 89 prior correct VCD assignments, where the axes are SNS (vertical) and ESI (horizontal). The closer a statistical point is to the upper right-hand corner of the plot, the higher the similarity of the comparison and the higher the degree of confidence. The upper right-hand corner of the plot is defined as 100% spectral similarity. The degree of confidence is a statistical measure that is set to be 100% confidence for points clustered in the upper right-hand region of the plot. Statistical measures such as these eliminate the reliance on only visual judgment for the comparison of measured and calculated VCD spectra and provide a statistical basis for assigning a degree of similarity between the measured and calculated spectra.
Change to read:
9 9. DETERMINATION OF ENANTIOMERIC EXCESS
After AC, the next most important property of a chiral sample is the EE, as described in 1. Introduction. For enantiomers labeled R and S, the EE for the R-enantiomer is defined as EE = (NR − NS)/(NR + NS) and %EE = EE × 100%. Here, NR represents the number of moles of the R- enantiomer present in the sample; for a solution, NR can represent the concentration of the R-enantiomer. Thus, %EE for the R-enantiomer can vary from +100% to −100%.
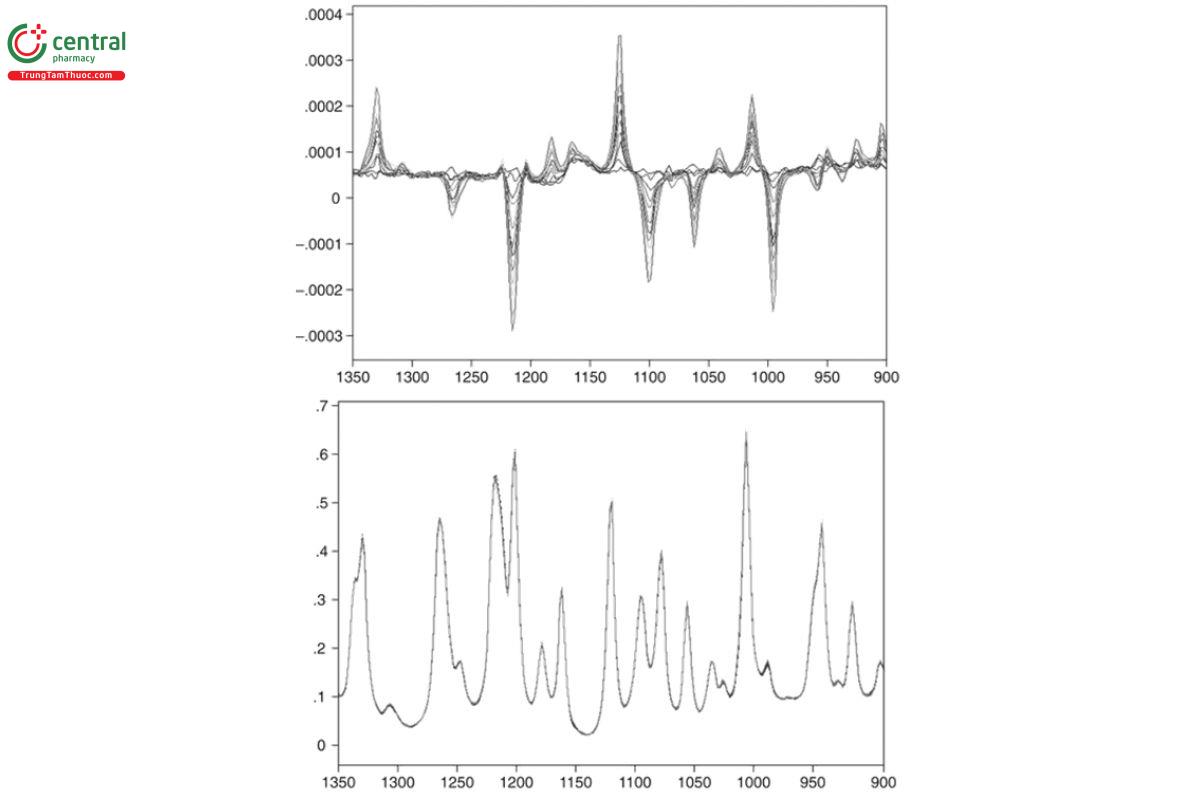
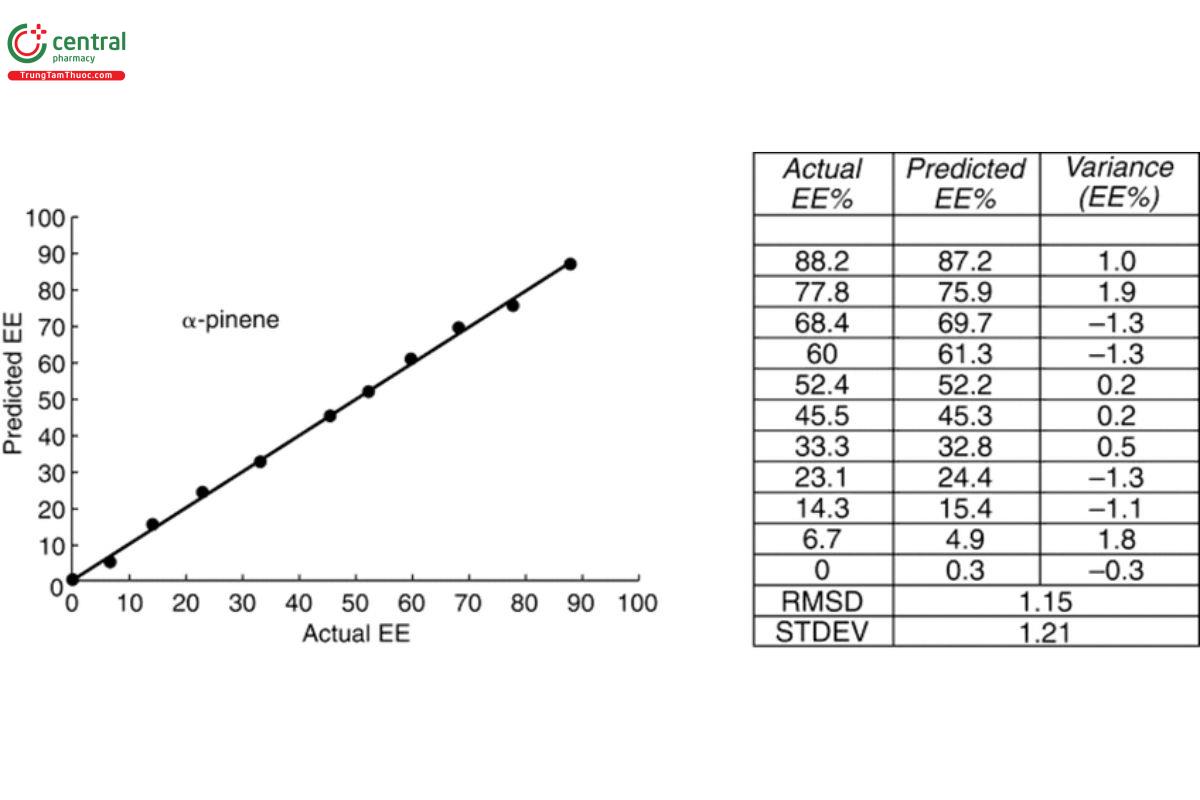
VCD spectra also can be used to determine the EE of a sample once the sample has been calibrated by a single IR and VCD measurement of a sample with a known EE. VCD scales linearly with EE with a maximum VCD intensity for a given IR intensity at 100% EE, one-half VCD intensity for the same IR intensity at 50% EE, and zero VCD for the racemic mixture of 0% EE. These points are illustrated in Figure 14 for 11 measurements of R-(+)-α-pinene for which the %EE decreases from 100% to 6.7%. The IR spectra are identical, but the VCD spectra grow smaller linearly as EE is reduced by the addition of measured amounts of the opposite enantiomer to the sample cell. The degree of accuracy of this determination of %EE was slightly >1%, as indicated in the plot of actual prepared EE versus VCD predicted EE, using a partial least- squares chemometric analysis as presented in Figure 15.
10 10. CONCURRENT USE OF VCD FOR ABSOLUTE CONFIGURATION AND EE
10.1 10.1 Chiral Raw Material Identification
Currently, there is no routine, real-time chiral measurement for material identification (ID). Chiral drug substances must comply with the USP–NF monograph tests that typically rely upon nonchiral test procedures such as mid-IR spectroscopy (Mid-Infrared Spectroscopy 〈854〉 and Mid-Infrared Spectroscopy—Theory and Practice 〈1854〉). In practice, near-IR (for additional information, see Near-Infrared Spectroscopy— Theory and Practice 〈1856〉) is used in many manufacturing facilities. For near-IR analysis of solids, analysts commonly use fiber-optic probes and then confirm the raw material by comparison of the measured spectrum against that of the USP Reference Standard. To determine the AC and EE of a chiral material, analysts must make a separate optical rotation measurement, which requires large amounts of sample in a 10-cm path-length cell, where uncertainty errors are possible for materials with small OR values.
A single measurement of the VCD spectrum and its associated IR spectrum in the mid-IR or near-IR region of a raw material, either as a crystalline solid or in solution, simultaneously contains information for the three critical measures: ID, AC, and EE. By comparison to a USP Reference Standard, the simultaneous measurement of IR and VCD spectra of a test material identifies the sample and the presence of impurities and separates impurities into achiral (IR only) or chiral (IR and VCD). The signs of the VCD identify the AC of the dominant enantiomer, and the ratio of the VCD to the IR gives the EE, as described above. Typical VCD accuracy for EE determinations is in the range of 0.1%–1%.
10.2 10.2 Chiral Quality Control
VCD can be used as a chiral measure for characterization of raw materials for process analytical technology (PAT) during development, synthesis, formulation, and final production of drug substances and drug products. VCD also can be used to test the interaction between formulated chiral drug substances and excipients. Currently, there are no protocols for monitoring EE as a quality control measure in the pharmaceutical industry. Because of the importance of chirality as a critical measure of sample integrity, there is a need for the incorporation of a new technology, such as VCD, to ensure the desired level of chiral quality of pharmaceutical products from discovery through to final formulation.
Change to read:
11 ADDITIONAL SOURCES OF INFORMATION (USP 1-DEC-2024)
Barron LD. Molecular Light Scattering and Optical Activity. Second edition, revised and enlarged. Cambridge University Press; 2009. Nafie LA. Vibrational Optical Activity: Principles and Applications. John Wiley & Sons; 2011.
Stephens PJ, Devlin FJ, Cheeseman JR. VCD Spectroscopy for organic chemists. CRC Press; 2012.
Freedman TB, Cao X, Dukor RK, Nafie LA. Absolute configuration determination of chiral molecules in the solution state using vibrational circular dichroism. Chirality. 2003;15:743–758.
He Y, Wang B, Dukor RK, Nafie LA. Determination of absolute configuration of chiral molecules using vibrational optical activity: a review. Appl Spectrosc. 2011;65(7):699–723.
Pivonka DE, Wesolowski SS. Vibrational circular dichroism (VCD) chiral assignment of atropisomers: application to γ-amino butyric acid (GABA) modulators designed as potential anxiolytic drugs. Appl Spectrosc. 2013;67(4):365–371.
Freedman TB, Dukor RK, van Hoof PJCM, Kellenbach ER, Nafie LA. Determination of the absolute configuration of (−)-mirtazapine by vibrational circular dichroism. Helv Chim Acta. 2002;85:1160–1165.
Guo C, Shah RD, Dukor RK, Cao X, Freedman TB, Nafie LA. Determination of enantiomeric excess in samples of chiral molecules using Fourier transform vibrational circular dichroism spectroscopy: simulation of real-time reaction monitoring. Anal Chem. 2004;76(23):6956–6966.
Guo C, Shah RD, Dukor RK, Cao X, Freedman TB, Nafie LA. Enantiomeric excess determination by Fourier transform near-infrared vibrational circular dichroism spectroscopy: simulation of real-time process monitoring. Appl Spectrosc. 2005;59(9):1114–1124. Guo C, Shah RD, Mills J, Dukor RD, Cao X, Freedman TB, Nafie LA. Fourier transform near-infrared vibrational circular dichroism used for on-line monitoring of the epimerization of 2,2-dimethyl-1,3-dioxolane-4-methanol: a pseudo racemization reaction. Chirality. 2006;18(10):775–782.
Kott L, Petrovic J, Phelps D, Roginiski R, Schubert J. Determination of a low-level percent enantiomer of a compound with no ultraviolet chromophore using vibrational circular dichroism (VCD): enantiomeric purity by VCD of a compound with three chiral centers. Appl Spectrosc. 2014;68(10):1108–1115.
Nafie LA. Dual polarization modulation: real-time, spectral-multiplex separation of circular dichroism from linear birefringence spectral intensities. Appl Spectrosc. 2000;54(11):1634–1645.
Nafie LA, Buijs H, Rilling A, Cao X, Dukor RK. Dual source Fourier transform polarization modulation spectroscopy: an improved method for the measurement of circular and linear dichroism. Appl Spectrosc. 2004;58(6):647–654.
Nafie LA. Vibrational circular dichroism: a new tool for the solution-state determination of the structure and absolute configuration of chiral natural product molecules. Nat Prod Commun. 2008;3(3):451–466.
Debie E, De Gussem E, Dukor RK, Herrebout W, Nafie LA, Bultinck P. A confidence level algorithm for the determination of absolute configuration using vibrational circular dichroism or Raman optical activity. ChemPhysChem. 2011;12(8):1542–1549.
