VALIDATION OF ALTERNATIVE METHODS TO ANTIBIOTIC MICROBIAL ASSAYS
If you find any inaccurate information, please let us know by providing your feedback here

Tóm tắt nội dung
This article is compiled based on the United States Pharmacopeia (USP) – 2025 Edition
Issued and maintained by the United States Pharmacopeial Convention (USP)
DOWNLOAD PDF HERE
1 INTRODUCTION
Microbiological assay methods have traditionally been used to quantify the potency, or antimicrobial activity, of antibiotics. These microbiological procedures were historically used to certify antibiotics on a lot-by-lot basis to ensure sufficient activity. Before 1998, monographs for several approved antibiotics were published in FDA’s Code of Federal Regulations, 21 CFR. These regulatory antibiotic assay procedures were later published in USP–NF as the official referee methods to determine the potency of antibiotics. The details of the microbial assay procedures for individual antibiotics, including the challenge organisms and test parameters, are described in Antibiotics— Microbial Assays 〈81〉. Microbial assays provide a direct measure of the effectiveness of the antibiotic against a reference microorganism. Although these microbiological methods have continued to serve as the official compendial referee methods since their publication in USP–NF, many manufacturers have replaced these microbiological analyses with high-performance liquid chromatography (HPLC) methods.
Although the microbiological methods provide direct proof of antimicrobial effectiveness and can integrate all moieties that contribute to antimicrobial effects in a formulation, these methods are less precise, more complex to perform, and slower to complete than alternative methods such as HPLC. Microbial assays also have limited selectivity and are not appropriate for evaluating organic impurities. The specific skill sets required to perform the microbiological antibiotic assays, their unique equipment requirements, and their comparative complexity deter many stakeholders from using these methods.
There are numerous reasons for replacing the microbiological antibiotic assays with chemical assays that use purity or content as surrogates for the measurement of biological activity. The advantages of chemical-based analytical methods have been described previously for simple, single-component antibiotics, as well as complex, multicomponent antibiotics (1). Physicochemical procedures, such as HPLC, allow for simpler preparation and rapid data acquisition with improved precision, accuracy, selectivity, and specificity. HPLC methods can be used effectively for both potency assignment and organic impurity testing. Additionally, because modern instruments and the expertise to use such equipment are widely available, the conversion to alternative methods may be economically advantageous.
This general chapter provides points to consider for manufacturers who want to use physicochemical alternatives instead of the microbial assay methods described in 〈 81〉. Given the widespread use of HPLC as an alternative to microbial assay methods, this chapter focuses on HPLC methods. However, the principles set forth in this chapter are applicable to any alternative physicochemical procedure.
Change to read:
2 GENERAL CONSIDERATIONS FOR ALTERNATIVE METHOD DEVELOPMENT
Multiple important factors need to be considered when replacing microbial methods with HPLC or other chemical techniques. This is because of the specific characteristics of antibiotics.
- It is essential to know whether the antimicrobial activity manifested by a preparation results from a single, active ingredient or arises from multiple, often related, moieties. Where technically possible, the analyst should determine the contribution of major moieties and the potential impact of their interaction (USP 1-Aug-2022) to antibiotic effectiveness. For the purposes of this chapter, major moieties are defined as those that contribute more than 1% of the antibiotic potency. Where multiple moieties contribute to antibiotic activity, the chemical assay should be able to resolve all major moiety peaks in the formulation.
- To the extent possible, the individual activities of process impurities and degradation products that contribute more than 1% of the antimicrobial activity of an antibiotic preparation should be evaluated. This may not be necessary where evidence exists that each of the process impurities and degradation products contributes less than 1% of the total antimicrobial activity of a preparation.
- As an alternative approach, testing a high number of lots of variable potency can be considered. A model taking into account the contribution of the process impurities and degradation products to the activity can be evaluated and validated. This approach may allow the demonstration of equivalency between the microbial assay and the alternative procedure without knowing the activity of individual moiety and impurity.(USP 1-Aug-2022)
- General chapter 〈 81 〉 is the referee standard in any procedure comparison. Therefore, the currently official USP procedure should be performed by the manufacturer (or under that manufacturer’s direction) to establish reference assay values within the test range. It may be necessary to evaluate data using the guidelines in Analysis of Biological Assays 〈1034〉. (USP 1-Aug-2022) Manufacturers should establish appropriate limits for precision and accuracy of the microbial assay procedure based upon their product knowledge.
- The candidate alternative HPLC or other chemical method should be fully validated according to Validation of Compendial Procedures〈 1225〉.
- The value of any method comparison is dependent upon the precision and accuracy of the assay test results obtained from both methods. No statistical comparison should be undertaken if the assay data from either method does not meet predetermined acceptance criteria for method validation.
- The guidelines in this chapter do not apply to already marketed products for which the manufacturer has already received regulatory approval to use an alternative method. In all cases, the applicability of an alternative method can only be determined through submission and review by the relevant regulatory authority.
- Any alternative to a compendial procedure must be validated and must produce comparable results to the compendial method or procedure within allowable limits established on a case-by-case basis(USP 1-Aug-2022) (2). A Stimuli article published in PF 35(3) [May–June 2009] discusses the “equivalent or better” approach to evaluating alternatives to compendial procedures (3). It is expected that such a comparison will use appropriate statistical analysis. Examples of the recommended types of statistical analyses are outlined in this chapter.
Change to read:
3 TECHNICAL CONSIDERATIONS
The microbial assay and the candidate alternative method should be performed as described in the appropriate general chapter (e.g.,〈 81〉 for microbial assays and Chromatography 〈621〉 for HPLC procedures); other physicochemical methods may be used (e.g., capillary electrophoresis) and should be conducted according to the specific general chapter. Stability-indicating alternative procedures are recommended.
Complex antibiotics, which have more than one active moiety, generally require additional data compared to simple antibiotics, where all or almost all antimicrobial activity is contributed by a single moiety.(USP 1-Aug-2022)
Change to read:
4 BRIDGING STUDIES
Bridging studies are used to compare the data obtained from candidate alternative procedures to the microbial assay data to determine whether the alternative procedure is an acceptable substitute. Two approaches for developing the alternative procedure are described in detail below.
4.1 Approach I
- Validate the candidate alternative procedure according to 〈1225 〉. The procedure should be specific, linear, precise, accurate, sensitive, robust, and stability indicating.
- Where process impurities or degradation products contribute more than 1% of the antimicrobial activity of an antibiotic preparation, the process impurities or degradation products should be evaluated whenever possible. Each antimicrobial moiety that has the potential to contribute more than 1% of the antimicrobial activity of the antibiotic preparation should be isolated, and values for the relative microbial activity factor (F) against the USP Reference Standard should be established. Note that purification of moieties present at low levels could be a difficult and time-consuming work. Also, evaluation of the activity of minor moieties can be difficult due to limited quantities available and precision associated with the purity of the samples. Active moieties including process impurities and degradation products at levels not more than 1% of antimicrobial activity may be disregarded. For simple antibiotics, this step may be skipped.
- Evaluate a suitable number of production lots of the antibiotic to determine the variation range of process impurities and degradation products of the antibiotic. When available, lots representing the specification range should be evaluated. This step is done before testing the samples using the two methods to evaluate the variation of the production and help the selection of representative batches for the bridging study.(USP 1-Aug-2022)
- (USP 1-Aug-2022)Test a minimum of three separate lots of the sample against(USP 1-Aug-2022) the USP Reference Standard using the microbial assay method and the candidate alternative procedure. It is important to select lots that cover the activity and purity specification range. Testing lots with similar activity and purity will not demonstrate method comparability. As a consequence, more than three lots will usually be tested. Successful method comparability necessitates testing lots with variation in activity and purity. Stability samples with varying amounts of active moieties should have a change in potency that directly correlates to the alternative method. Forced degradation products or out-of-specification (OOS) lots may be introduced in the study to strengthen its robustness.
- A minimum of three replicate samples per lot using both the candidate alternative method and the microbial assay procedures should be tested. One replicate is defined as the test measurement of one sample preparation (i.e., one sample stock solution). When a limited number of similar lots is used, it (USP 1-Aug-2022) may be necessary to increase the number of replicates based on the maximum allowed percentage difference (see Data Evaluation) and the standard deviation of the method (4). When a complex antibiotic displays significant composition variability, more lots may be used in the study with reduction in the number of replicates. The number of lots and replicates should be balanced according to the precision of each method and the complex antibiotic composition variability to ensure the maximum potential causes of variability are taken into account. If the HPLC assay has better precision than the microbial assay, fewer replicates may be needed. Manufacturers may work with the relevant regulatory authority to decide whether the replicates and lots are sufficient to demonstrate the method equivalency. Appendix 4 presents one methodology for determining sample size for bridging studies.(USP 1-Aug-2022) If possible, prepare standard stock and sample solutions and subdivide them for use with the microbial assay and candidate alternative assay procedures. This provides paired data that can be analyzed (see Appendix 2).
- Use the relative microbial activity factor (F) to convert the percentage purity values for each moiety, and then sum them to determine a combined potency value. For example, potency= ΣxiFi, where x is the content of moiety i and Fi is its relative microbial activity factor.
- Apply the appropriate analysis on the results obtained by the two methods to determine whether the candidate alternative and the microbial assay procedures yield comparable results. If necessary,(USP 1-Aug-2022) apply appropriate outlier (see Analytical Data — Interpretation and Treatment 〈1010〉 and 〈81〉) and comparison tests (see Data Evaluation). The number of outliers should be limited and justification for their rejection should be provided in the bridging study report.(USP 1-Aug-2022)
- (USP 1-Aug-2022)If the bridging study fails, it may be necessary to include potency contributions from process(USP 1-Aug-2022) impurities and degradation products (USP 1-Aug-2022) that make a contribution below 1% or take into account synergistic activity. Additional analysis may also be required to evaluate the accuracy of measured purity of isolated impurity samples.
4.2 Approach II
In the case of complex antibiotics, it can be difficult, time-consuming, or even technically infeasible to separate and purify all active antimicrobial moieties and test their activity. An alternative approach that tests a significant number of lots of samples may be considered. An example of this approach implemented for proteins can be found in a Stimuli article published in PF 40(4) [July–Aug. 2014] (5).
- Validate the candidate alternative procedure according to 〈1225〉. The procedure must be specific, linear, precise, accurate, sensitive, robust, and stability indicating.
- Identify moieties that may contribute to antimicrobial activity. Active moieties including process impurities and degradation products at levels below 1% of antimicrobial activity may be disregarded.
- Test an appropriate number of lots, with varying amounts of active moieties covering the specification range, by both methods. Forced degradation products and/or OOS lots may be used in the study to demonstrate robustness. These are called "training lots". The number of replicates and lots should be based on the maximum allowed percentage difference (see Data Evaluation) and the standard deviation of the method (4). Appendix 4 presents one methodology for determining sample size for bridging studies. Manufacturers may work with the relevant regulatory authority to decide whether the replicates and lots are sufficient to demonstrate the method equivalency and whether the model is appropriate. When possible, prepare standard stock and sample solutions and subdivide them for use with the microbial assay and candidate alternative assay procedures. This provides paired data that can be analyzed (see Appendix 2).
- Identify an appropriate model to convert the sum of percentage purity values for each moiety to a combined potency value by applying conversion factors (F). For example, potency = Σx F , where potency is the microbial activity from the microbial test; x is the content of moiety from the physicochemical method; F is the conversion factor. F is determined in step 5. More complex models may be used.
- Apply appropriate statistical analysis on the results obtained by the two methods to determine the conversion factors (F) so that the candidate alternative procedure and the microbial assay procedure yield equivalent results to find out the correlation between the two methods. Confirm the validity of the model obtained by comparing the predicted and obtained potency on another set of lots called "validation lots". The involvement of a statistician to help design the study, determine the relevant variables, analyze the results, and define the model is highly recommended. Outlier analysis in step 7 of Approach I can be applied.
- Stability samples with varying amounts of active moieties should have a change in potency that directly correlates to the alternative method.
- If the bridging study fails, it may be necessary to test the relative microbial activity for each moiety as stated in Approach I.(USP 1-Aug-2022)
Change to read:
5 DATA EVALUATION
Described below are USP’s recommendations for data evaluation. Alternative approaches such as Deming regression (6 ) (USP 1-Aug-2022) may also be used. For an antibiotic with a comparatively narrow assay range (80%–125% or narrower), follow step 1. For an antibiotic with a wide assay range (80%–125% or wider), follow steps 1 and 2.
- Demonstrate the equivalence of results at the targeted potency of 100% using a two one-sided test (TOST) to test for equivalence. TOST offers several advantages over the t-test, which looks for differences (7–10). This requires the laboratory to set a maximum allowed percentage difference (such as 3%, 4%, or 5%), denoted by k in the appendices. Use the formulas in Appendix 1 for independent samples (different samples used for the two procedures) or Appendix 2 for paired samples (a set of samples each of which is assayed by both procedures).
- Compare the chapter microbial assay and candidate alternative assay procedures using (USP 1-Aug-2022) samples that cover the full monograph range of activity values. Prepare a Bland–Altman (BA) plot (Appendix 3). There should be no evidence of an important trend and the BA 95% agreement limits should not extend outside a predetermined maximum difference established by the laboratory.
Change to read:
6 APPENDIX 1: TOST FORMULAS FOR INDEPENDENT SAMPLES
On the basis of the knowledge of the product, the laboratory must establish the maximum allowed percentage difference between the average result for the candidate alternative assay and the average ▲result▲ (USP 1-Aug-2022) for the microbial assay. (USP 1-Aug-2022) A difference that meets the requirements indicates that the alternative method provides acceptable results in the specified compendial range as compared with the microbial assay. In statistical notation, what must be demonstrated is:
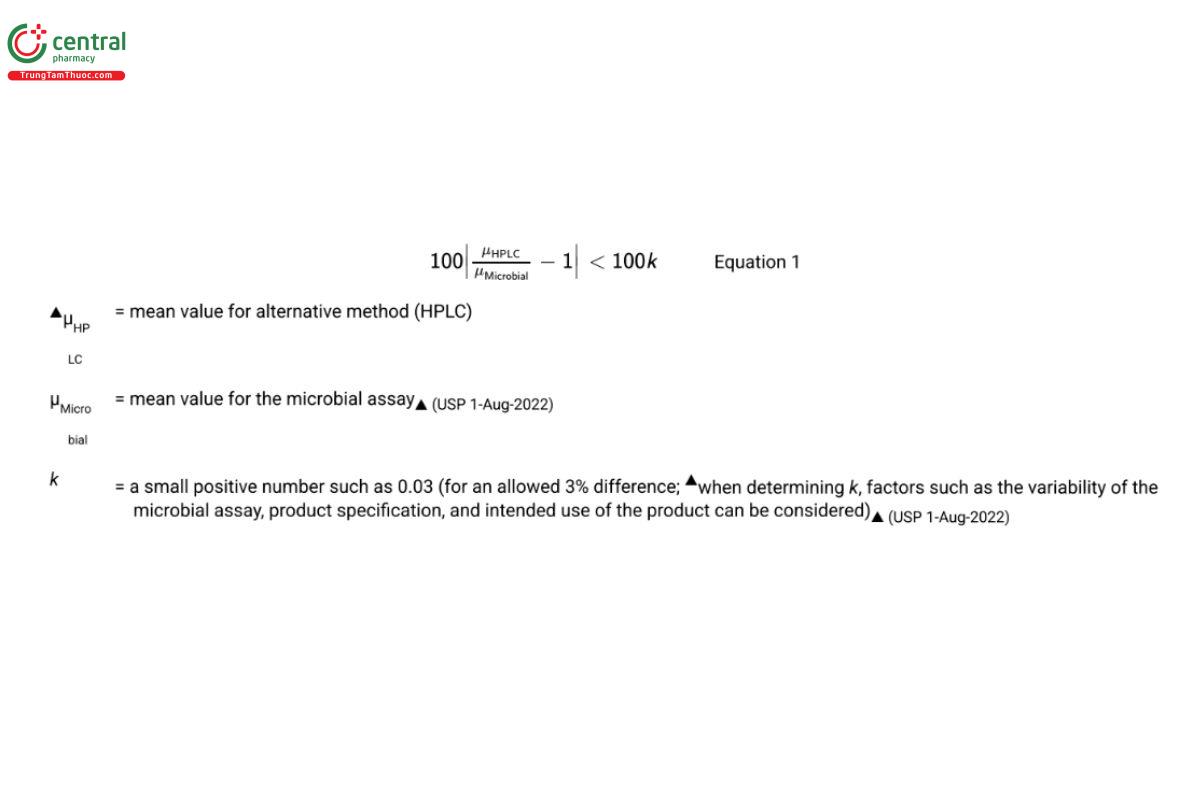
These are the two values to be compared. Rearranging, this becomes:
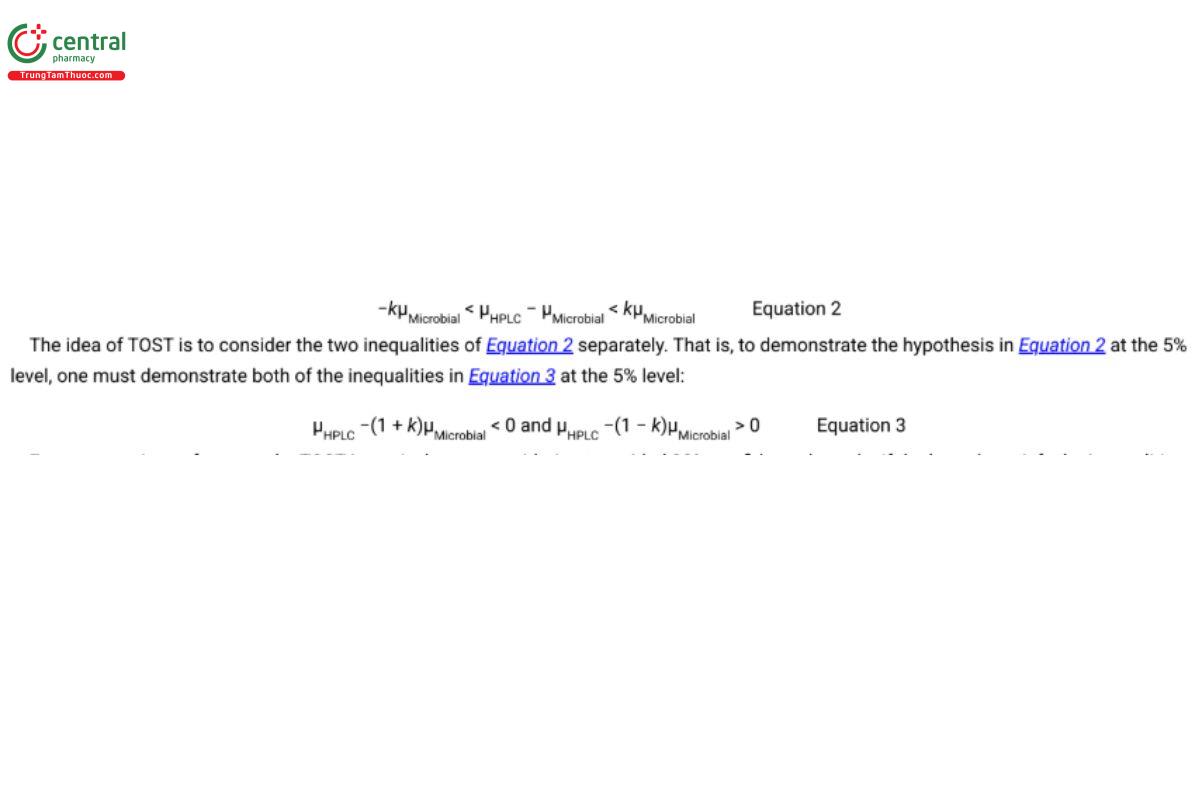
For a comparison of means, the TOST is equivalent to considering two-sided 90% confidence bounds. If the bounds satisfy the inequalities in Equation 3, then equivalence has been demonstrated. When the samples for the two assays under comparison are different (“independent samples”), determine the following upper (U) and lower (L) confidence bounds:
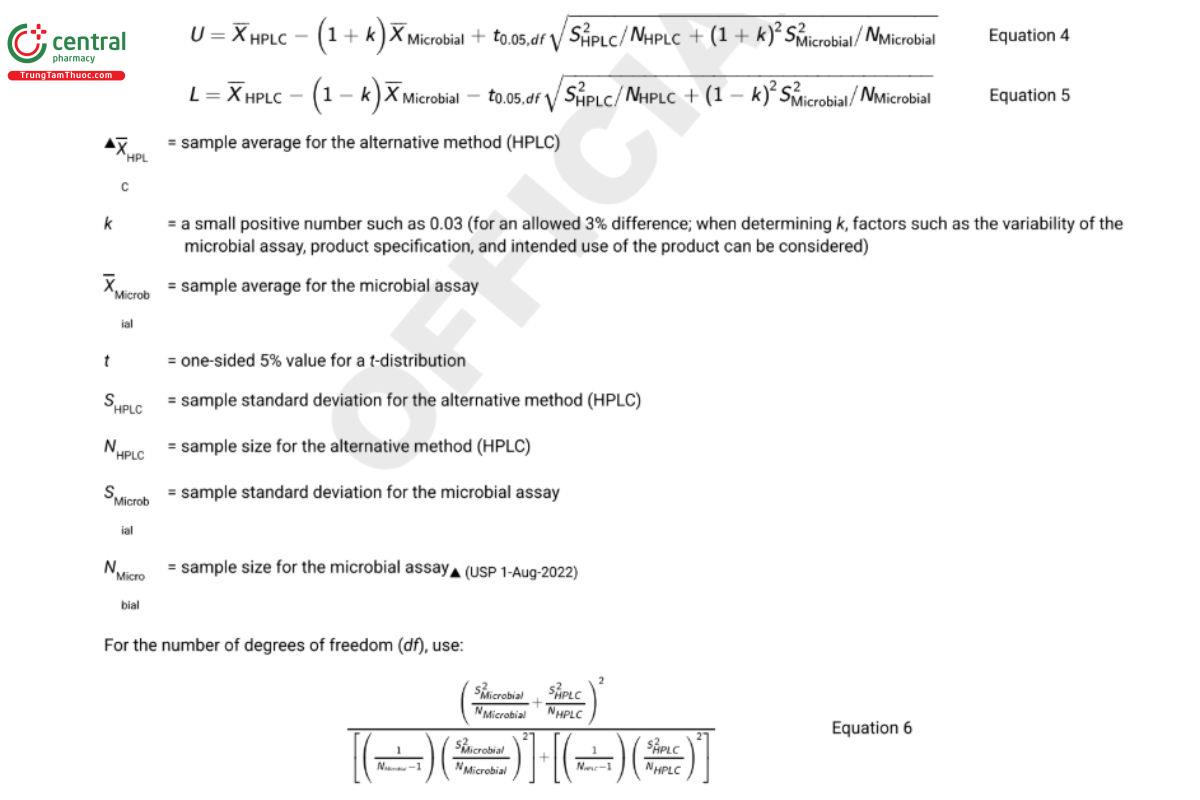
This is an approximation that assumes k is small. If using software that only allows for integer degrees of freedom (e.g., Excel), use linear interpolation to obtain the t-value. Conclude that the two procedures are equivalent (i.e., any difference on average is acceptably small) for the given lot (L) if:
L > 0 and U < 0 Equation 7
Example 1 (Results for one sample lot): (USP 1-Aug-2022)
| Microbial Assay Data | HPLC Assay Data |
| 72.02 | 72.38(USP 1-Aug-2022) |
| 67.3 | 71.92 (USP 1-Aug-2022) |
| 71.79 | 72.25 (USP 1-Aug-2022) |
| 71.16 | - |
| 69.06 | - |
| 75.56 | - |
| 74.7 | - |
| 74.16 | - |
| 76.48 | - |
Following the above formulas with k = 0.03:
Change to read:
APPENDIX 2: TOST FORMULAS FOR PAIRED SAMPLES
When the samples for the two assays are the same, the data are considered “paired”. The hypotheses are the same as those in Appendix 1. Because of the pairing of samples, the standard deviation calculations differ.
Determine the confidence bounds, U and L, as follows:
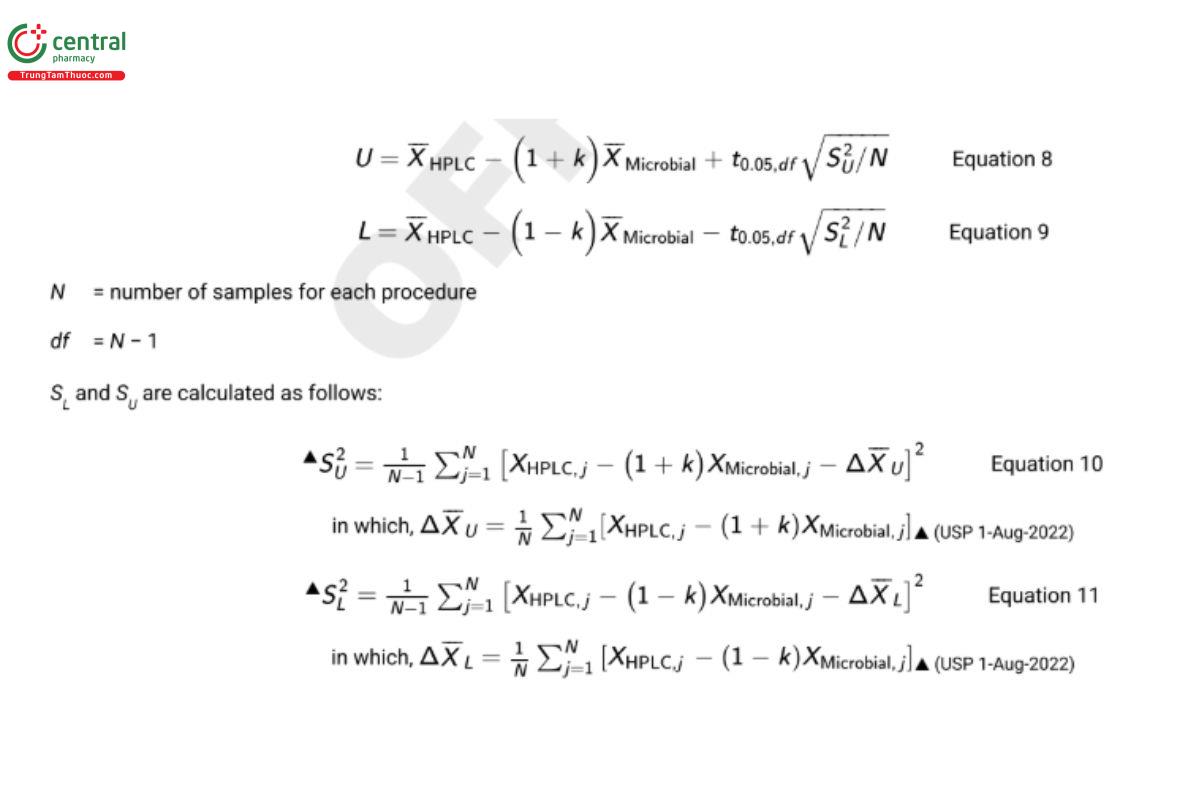
Conclude that the two procedures are equivalent (i.e., any difference on average is acceptably small) for the given lot if:
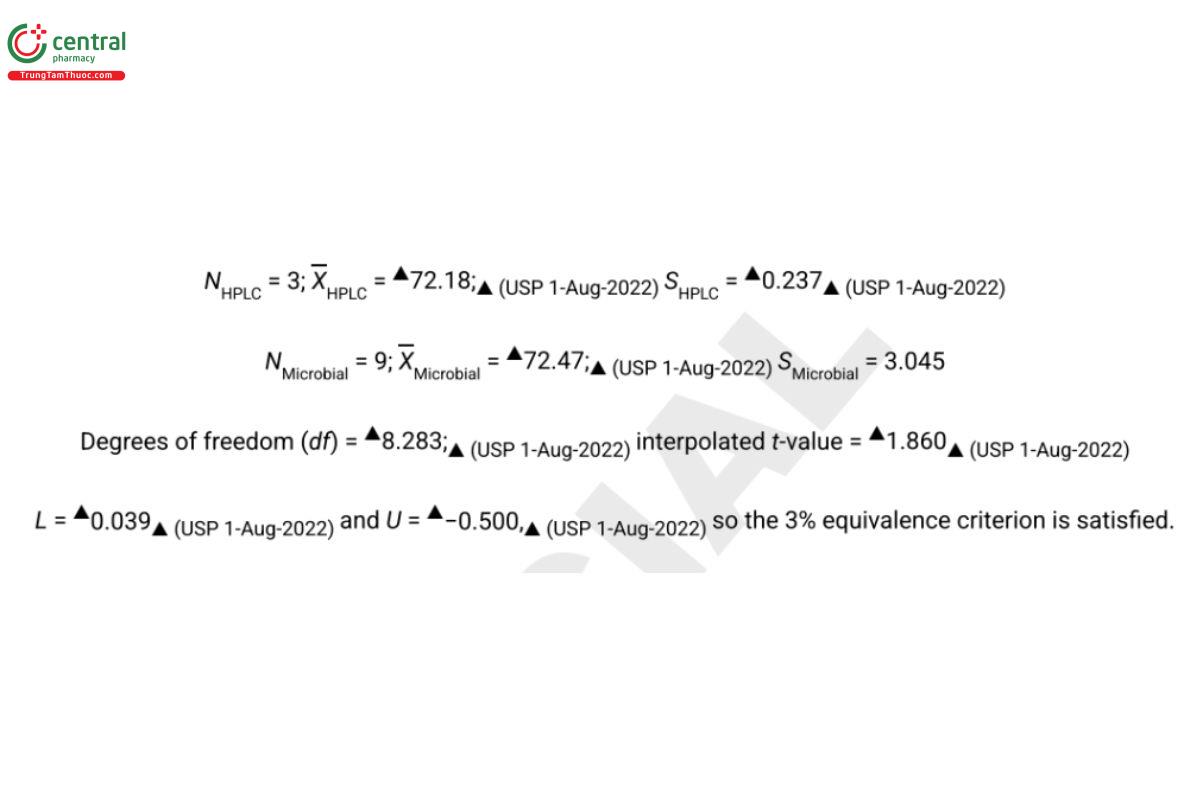
L > 0 and U < 0 Equation 12 Example 2 (Results for multiple sample lots): (USP 1-Aug-2022)
| Microbial Assay Data | HPLC Assay Data |
| 1011 | 980.9 |
| 990 | 981.4 |
| 960 | 978.3 |
| 1000 | 974.3 |
| 970 | 966.7 |
Following the above formulas with k = 0.03:
N = 5; XHPLC = 976.3; XMicrobial = 986.2
SL = 18.749; SU = 19.958
df = 4; t-value = 2.132
L = 1.830 and U = −20.438, so the 3% equivalence criterion is satisfied.
Change to read:
7 APPENDIX 3: BLAND–ALTMAN PLOTS
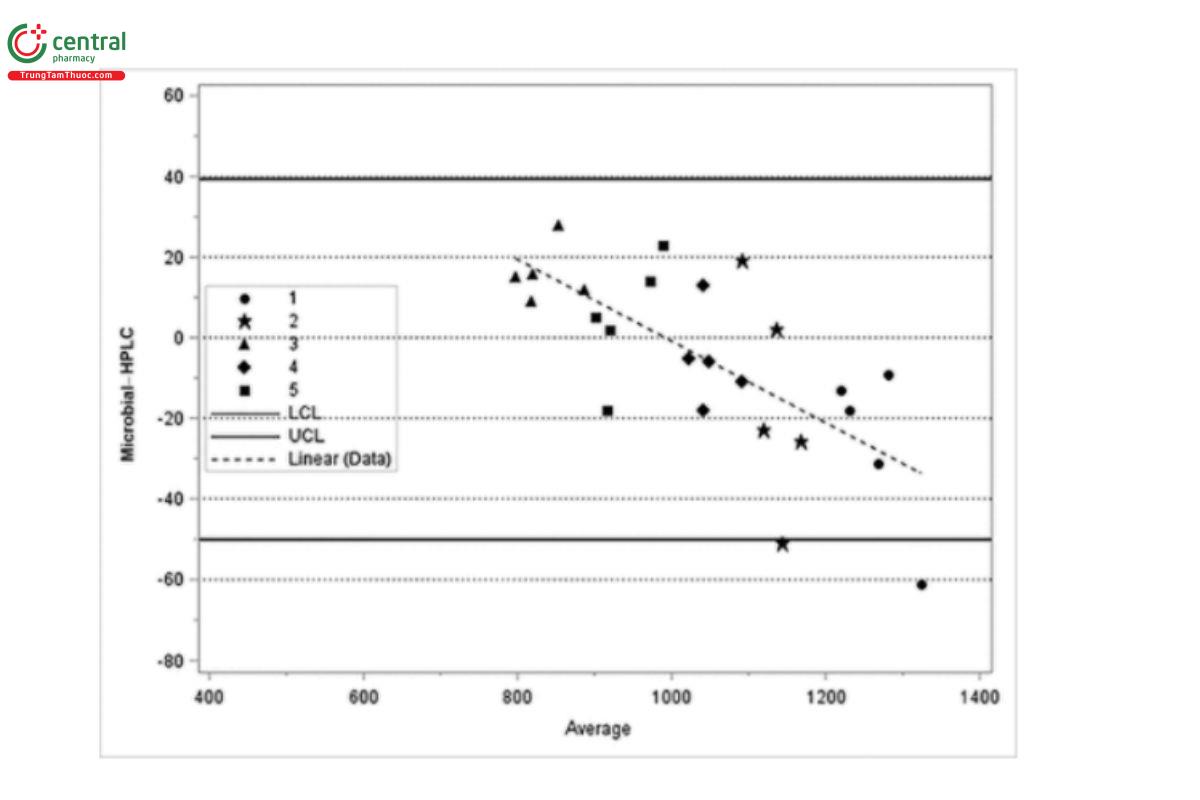
Figure 1 shows the data plotted as HPLC assay (x-axis) versus microbial assay (y-axis). In Figure 2, the x-axis represents the average response obtained using the alternative and microbial assay methods. The y-axis represents the difference in responses measured with the alternative and microbial assay methods.
The bias for each data set is represented by the average difference. 95% limits of agreement are represented by bias ± 2S.
Data points outside the limits of agreement are considered outliers.
The BA plot (11–12) should show data points scattered within the limits of agreement with no obvious pattern. If a pattern exists (e.g., proportional pattern or funneling outwards with increasing average), perform a log transformation. If performing a log transformation, take the antilog of results for analysis using the original scale of measurement.
Example 3:
| Lot | Microbial Assay Data | HPLC Assay Data | Microbial Assay−HPLC Assay |
| 1 | 1213 | 1226 | -13 |
| 1253 | 1284 | -31 | |
| 1276 | 1285 | -9 | |
| 1293 | 1354 | -61 | |
| 1222 | 1240 | -18 | |
| 2 | 1155 | 1181 | -26 |
| 1108 | 1131 | -23 | |
| 1118 | 1169 | -51 | |
| 1101 | 1082 | 19 | |
| 1136 | 1134 | 2 | |
| 3 | 896 | 881 | 12 |
| 805 | 790 | 15 | |
| 827 | 811 | 16 | |
| 821 | 812 | 9 | |
| 867 | 839 | 28 | |
| 4 | 1085 | 1096 | -11 |
| 1032 | 1050 | -18 | |
| 1046 | 1052 | -6 | |
| 1019 | 1024 | -5 | |
| 1048 | 1035 | 13 | |
| 5 | 1000 | 977 | 23 |
| 920 | 918 | 2 | |
| 978 | 964 | 14 | |
| 906 | 924 | -18 | |
| 903 | 898 | 5 |
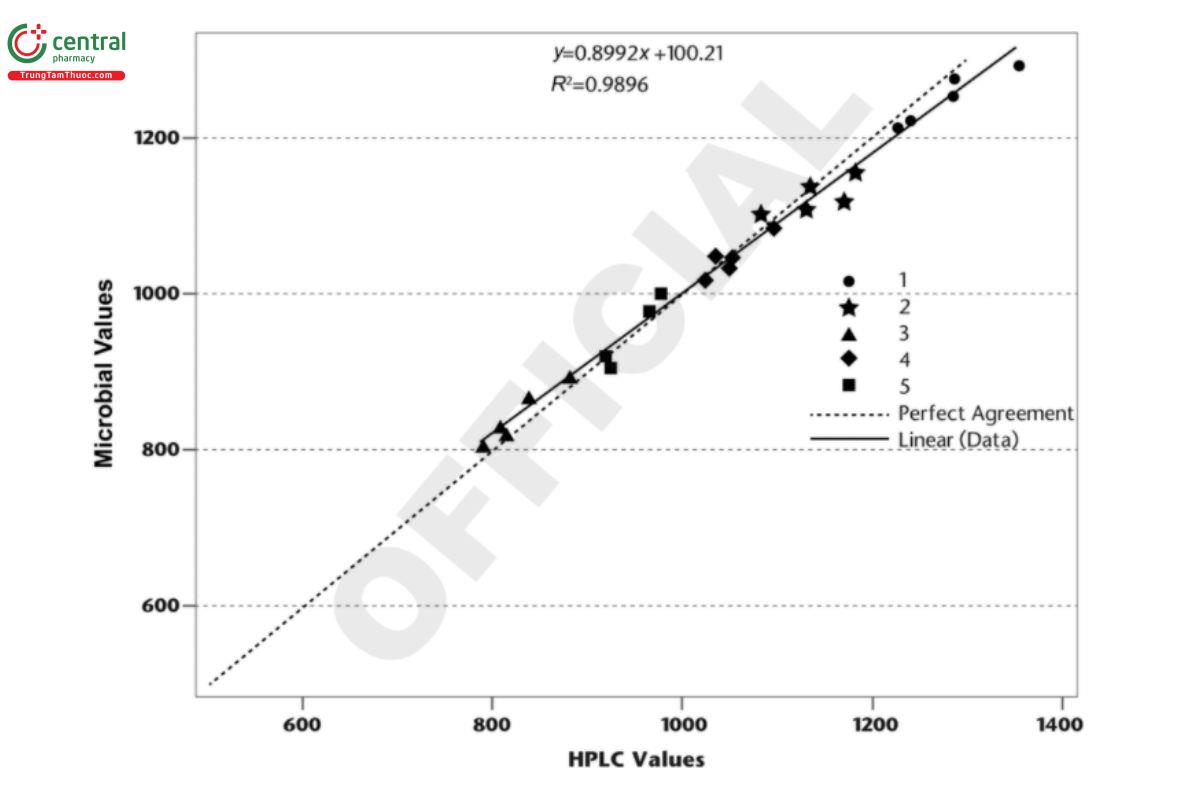
Figure 1. Example data plotted as microbial assay data versus HPLC assay data. (R2= coefficient of determination)
(USP 1-Aug-2022)
Figure 1 shows the data plotted as microbial (y-axis) versus HPLC (x-axis). This appears to be in good agreement. Figure 2 shows what happens when the same data are instead plotted as recommended by Bland–Altman.
(USP 1-Aug-2022)
Calculate the bias, estimated by the mean difference (d) and standard deviation (SD) of the difference:
d = −5.28
SD of difference = 22.36
Most of the differences are expected to lie between d − 2SD and d + 2SD (if normally distributed, 95% will lie in these limits). If differences within d ± 2SD (limits of agreement) are not important, the two measurement methods can be used interchangeably:
LCL (d − 2SD) = −49.95 Equation 13
UCL (d + 2SD) = 39.39 Equation 14
The difference between results from the two procedures has a strong trend. This trend can be seen in Figure 1, but the BA plot in Figure 2 makes it clearer.
Add the following:
8 APPENDIX 4: SAMPLE SIZE JUSTIFICATION FOR ANTIBIOTIC BRIDGING STUDIES
The methodology for determining sample size for antibiotic bridging studies presented in 〈1010〉 for the estimate to reflect the equivocal zone can be used. Table 1 lists the sample sizes corresponding to different choices for three parameters in Equation 15.
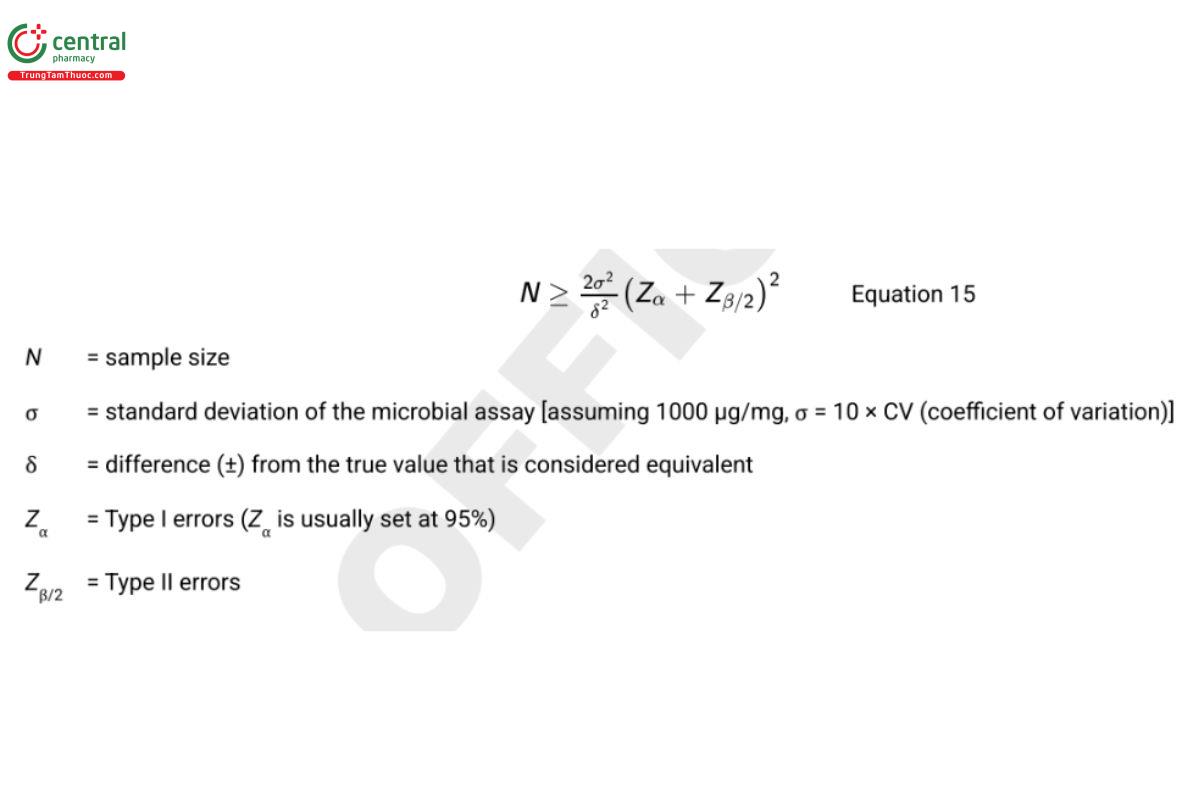
Table 1
| Power | Zβ/2 | δ | σ | N |
| 80% | 0.842 | 30 | 50 | 35 |
| 40 | 50 | 20 | ||
| 50 | 50 | 13 | ||
| 60 | 50 | 9 | ||
| 70 | 50 | 7 | ||
| 80 | 50 | 5 | ||
| 90% | 1.282 | 30 | 50 | 48 |
| 40 | 50 | 27 | ||
| 50 | 50 | 18 | ||
| 60 | 50 | 12 | ||
| 70 | 50 | 9 | ||
| 80 | 50 | 7 (USP 1-Aug-2022) |
Change to read:
9 REFERENCES
- Wright W. Use of liquid chromatography for the assay of antibiotics. Pharm Forum. 1994;20(5):8155–8159.
- USP. General notices: 630 Alternative and harmonized methods and procedures. In: USP–NF. Rockville, MD.
- Hauck WW, DeStefano AJ, Cecil TJ, Abernethy DR, Koch WF, Williams RL. Acceptable, equivalent, or better: approaches for alternatives to official compendial procedures. Pharm Forum. 2009;35(3):772–778.
- Borman PJ, Chatfield MJ, Damjanov I, Jackson P. Design and analysis of method equivalence studies. Anal Chem. 2009; 81(24):9849–9857.
- Bachmann H, Hothorn LA, Haug H, Dingermann T. Physico-chemical method for the prediction of the bioactivity of epoetin beta batches. Pharm Forum. 2014;40(4). (USP 1-Aug-2022)
- Cornbleet PJ, Gochman N. Incorrect least-squares regression coefficients in method-comparison analysis. Clin Chem. 1979;25(3):432–438.
- Schuirmann DJ. A comparison of the two one-sided tests procedure and the power approach for assessing the equivalence of average bioavailability. J Pharmacokinet Biopharm. 1987;15(6):657–680.
- Limentani GB, Ringo MC, Ye F, Bequist ML, McSorley EO. Beyond the t-test: statistical equivalence testing. Anal Chem. 2005;77(11):221A–226A.
- Chambers DC, Kelly G, Limentani G, Lister A, Lung, KR, Warner E. Analytical method equivalency: an acceptable analytical practice. Pharm Technol. 2005;9:64–80.
- Chatfield MJ, Borman PJ. Acceptance criteria for method equivalence assessments. Anal Chem. 2009; 81(24):9841–9848.
- Bland JM, Altman DG. Measuring agreement in method comparison studies. Stat Methods Med Res. 1999;8(2):135–160.
- Bland JM, Altman DG. Statistical methods for assessing agreement between two methods of clinical measurement. Lancet. 1986;1(8476):307–310.
