Ultraviolet-Visible Spectroscopy—Theory and Practice
If you find any inaccurate information, please let us know by providing your feedback here

Tóm tắt nội dung
This article is compiled based on the United States Pharmacopeia (USP) – 2025 Edition
Issued and maintained by the United States Pharmacopeial Convention (USP)
1 THEORY
Ultraviolet-visible (UV-Vis) spectroscopy is an electronic transition spectroscopic technique in which the interaction between incident radiation and electrons results in the promotion of one or more of the outer or the bonding electrons from a ground state into a higher-energy state. This quantum effect results in a specific absorption of radiation, the frequency and wavelength of which are governed by the equation: E = hv = ( hc/λ) × 109
where:
E = energy
h = Planck's constant (6.63 × 10⁻³⁴J · s)
ν = frequency (Hz), related to the energy change ΔE, induced when electromagnetic radiation is absorbed (ΔE = hν per photon) c = velocity of light (2.998 × 10⁸ m/s)
λ = wavelength (nm)
All absorption of ultraviolet (UV) and visible (Vis) radiation in organic molecules is restricted to certain functional groups (chromophores) that contain valence electrons of low excitation energy. The spectrum of a molecule containing these chromophores is complex. This is because the superposition of rotational and vibrational transitions on the electronic transitions gives a combination of overlapping lines. This appears as a continuous absorption band, in the form of a bell-shaped peak. As a general rule, small molecules absorb somewhere in the ultraviolet region, and the greater the extent to which the p electrons are delocalized over a ring or a larger complex multiple-ring or branched structure, the longer the wavelength of the first absorption band (i.e., the band of lowest energy and longest wavelength). This delocalization over multiple-ring structures can shift the wavelength into the visible region and is responsible for the observed color of the substance.
Change to read:
2 UV-VIS SPECTROMETERS
All modern UV-Vis measurements involve detecting and measuring the intensity ratio of the radiation at a certain wavelength in the presence or absence of the absorbing sample (transmitted radiation and incident radiation). Figure 1shows schematics of four typically encountered optical designs: single-beam, single split-beam (where the reference detector is located within the internal optics of the system), double-beam, and reverse optic array spectrometers. Dispersion of light to achieve the desired resolution can occur before (as in the first three configurations) or after introduction of the sample, but all commercial UV-Vis instruments share the following features to perform these functions:
- Continuum source
- Monochromator or polychromator
- Sampling area
- Detector
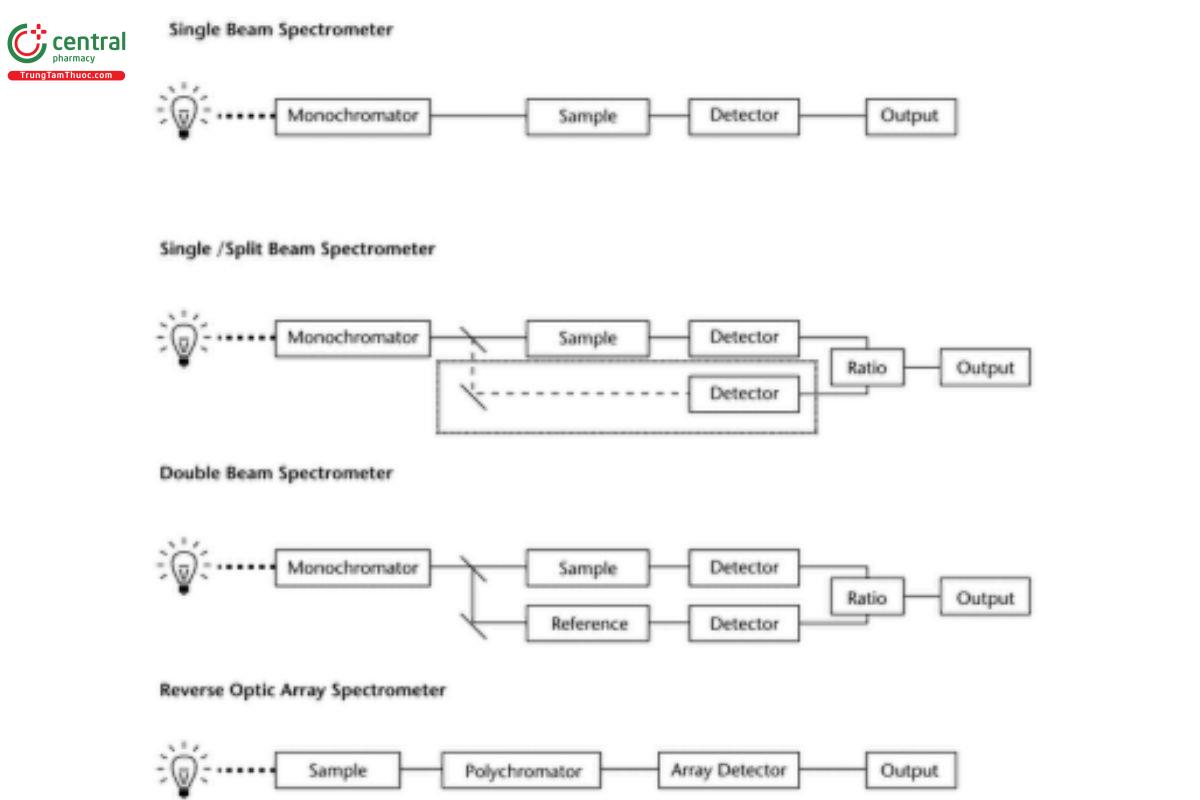
Figure 1. Typical spectrometer designs.
Care must be taken to ensure that the sample is not degraded by the incident light beam and that any heating effects are minimized. This is particularly important when photodiode array instruments are used because the sample is irradiated at all wavelengths.
Continuum Source
Two major types of continuum source are currently in use: continuous and pulsed. Continuous sources include tungsten halogen for visible, deuterium arc for UV, and xenon arc for both. The source for pulsed radiation is the xenon ash lamp. Many UV-Vis instrument systems use a combination of deuterium and tungsten halogen to effectively cover the UV and visible regions, respectively. By necessity, source selection is achieved either by the use of a mirror system to select the appropriate source, positioned manually or by using a hardware and software combination. This change usually is performed in the region of 320–350 nm, and thus qualification of the system must be performed using both source and mirror positions. Systems based on xenon lamps have the benet of a single source and a higher energy output, but they are more expensive.
Monochromator
The wavelength scale can be encoded by either a scanning monochromator or a grating polychromator (see Figure 2), as is the case for spectrometers equipped with linear or two-dimensional array detectors. A discussion of the specific benefits and drawbacks of each of the dispersive designs is beyond the scope of this general chapter. Any properly qualified instrument should be suitable for qualitative measurements. Care must be taken when selecting an instrument for quantitative measurements because dispersion, response linearity, and stray light may not be uniform across the full spectral range. Appropriate qualification procedures can be found in
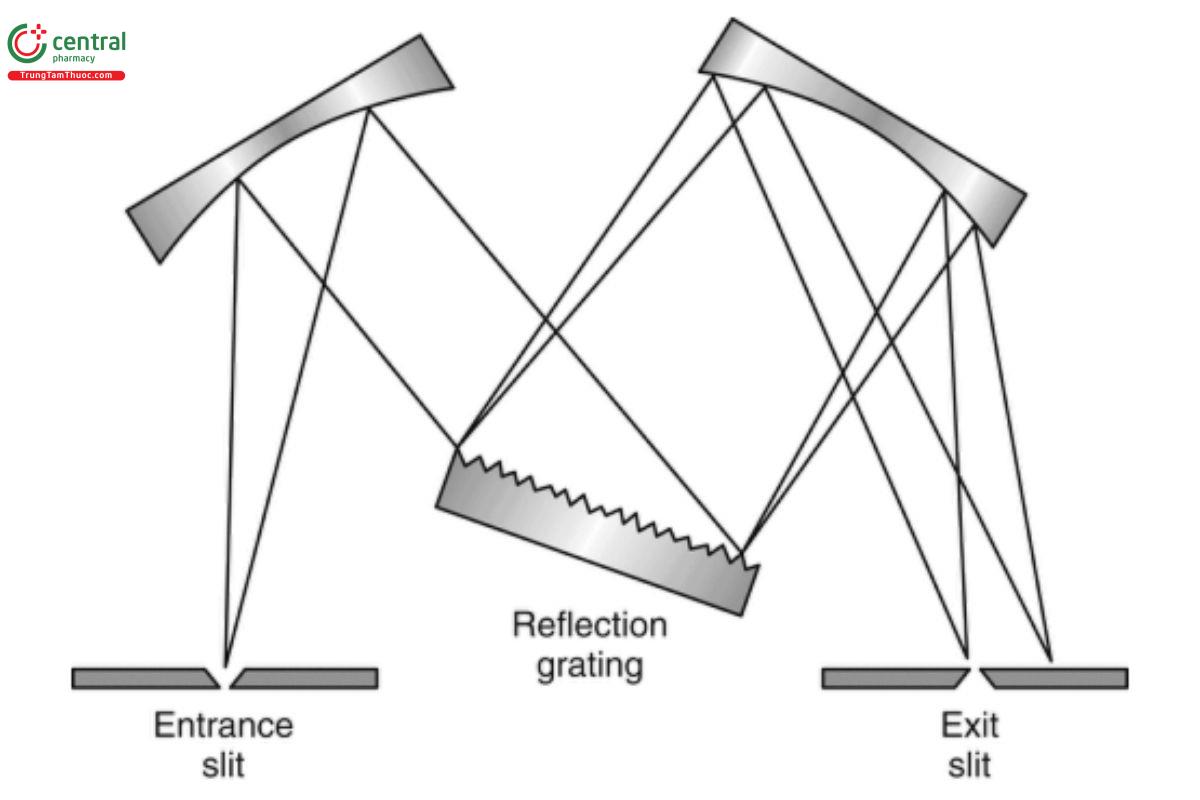
Figure 2. Grating monochromator.
Sampling Area
Numerous sampling arrangements are available in addition to the cuvette holders that are designed to accommodate various path-length configurations based on conventional rectangular cuvettes. These include flow cuvettes, (USP 1-Dec 2022) ber-optic-based immersion probes, multi-channel plate configurations, and automated sample changers, among others. Considerations such as sampling volume, speed of measurement, and reproducibility of sample presentation should be evaluated to optimize the sampling device for specific applications.
Detector
Photoelectric detectors, which are the most common form of UV-Vis detectors, generate an electric current that is directly proportional to the intensity of the radiant energy incident upon them. They may take the form of photosensitive semiconductor devices, either discrete detectors, linear or two-dimensional arrays, or photomultipliers. Photosensitive semiconductor devices include solid-state photodiodes, charge-coupled device arrays (CCDs), and phototransistors. The most common semiconductor material is silicon, which is sensitive to wavelengths of 400–800 nm, but some silicon devices have extended sensitivity from as short a wavelength as 190 nm to as long a wavelength as 1100 nm. The dynamic response of these detectors typically is four orders of magnitude. Most photodiode array detectors are made of silicon and hence have a similar wavelength response. Other semiconductor materials can provide wavelength response to several micrometers.
In contrast, photomultipliers are vacuum detectors that have a photocathode in which photon energy releases electrons that are directed by the eld applied to electron-sensitive plates. By a cascade effect, these dynodes amplify the electrons released initially by the absorption of the incident radiation. Photomultipliers have typical wavelength responses of 160–900 nm, although some photocathode materials can provide response to higher wavelengths. The dynamic response of these detectors typically is six orders of magnitude or higher.
Change to read:
3 ALTERNATIVE UV-VIS SPECTROMETER CONFIGURATIONS
Photodiode Array Spectrometers
With photodiode array detection, the optical configuration is reversed from that in a conventional spectrometer, and the light beam passes through the sample before being dispersed by the polychromator. This gives the benet of fast, full spectral data with no moving parts that can wear out. The perception is, therefore, that photodiode arrays are more reliable than other detectors. This is true, but the reverse-optics design requires that both the sample and optics before the dispersing element (usually a grating) are subjected to the full-spectrum radiation also encountered by these components in a conventional spectrometer. In a conventional spectrometer, the sample and optics are outside the monochromator, and optical beam deflection and/or scattering simply reduces the intensity of the light that enters the monochromator. In an array-based spectrometer, deflection occurs within the polychromator, causing scatter within the conned environment of these devices, resulting in an associated increase in stray light. As detailed in Stray Light, that leads to a reduction in optimum photometric range as shown in Figure 3.
HPLC UV-Vis Detectors
The design of a UV-Vis spectrometer is always the result of a number of considered compromises. For example, optical performance (absolute wavelength resolution) is governed by the focal length of the monochromator, which in turn dictates the physical size of the instrument. In the case of HPLC UV-Vis detectors used for peak homogeneity assessment and identification procedures using the spectrum at the peak apex, the need to provide a high-stability, low S/N ratio output at high transmittance levels through a small-aperture flow cuvette requires that by design these systems may not have the dynamic range or wavelength accuracy of their conventional spectroscopic counterparts.
Fiber-Optic-Based Modular Systems
In recent years there has been a rapid increase in the availability and use of systems built around the ability of ber optics to channel and multiplex optical systems. Although these systems have the advantages of flexibility and ease of use and they allow measurements to be performed on multi-channel plate readers, modular user-designed and -built systems, etc., analysts must consider the following disadvantages:
Some analysts assume that these array-based ber-optic systems are immune to room light interference at the sample interface, which may or may not be true. This assumption is easily tested by using a black photographic lm-changing bag or a simple black cloth. Use of a masking technique should not change the measured value if the assumption is true.
Custom-built systems may not have additional shuttering, stray light filtering, and other capabilities that are found in commercially designed spectrometers. Light levels transmitted directly down fibers from high-intensity sources such as Xenon ash lamps may cause photodegradation of the sample being measured by the system. In these systems, the source may be coupled by fiber directly to the sample interface, and the only control is the source on/off switch. Therefore, by design, the performance characteristics, i.e., the optimum photometric range, may have to be significantly reduced, if possible, to allow the system to be qualified according to 〈857〉.
Add the following:
4 UV-VIS INSTRUMENT PERFORMANCE INDICATORS
Spectral Bandwidth—Effect on Resolution and Signal-to-Noise Ratio
Appropriate spectral bandwidth (SBW) is important to ensure adequate peak resolution. The selection of the SBW always requires balancing adequate resolution against maximization of the signal-to-noise (S/N) ratio. During method development, analysts should optimize the resolution by selecting the narrowest slit width that provides an adequate S/N ratio because optimum resolution is achieved when the S/N ratio is maximized. By design, the entrance and exit slits of the monochromator will be mechanically matched together to achieve the same physical separation and associated dispersion (usually triangular) to produce the required SBW. If access to a variable-bandwidth instrument is available, then the optimum setting can be defined as the narrowest slit width at which no significant reduction in peak intensity is observed. If accurate absorbance measurements must be made on benzenoid compounds or other compounds with sharp absorption bands (natural half-bandwidths of <15 nm), the SBW of the spectrometer used should not be greater than 1/8th of the natural half bandwidth of the compound’s absorption; i.e., this equates to a spectrometer with a SBW of 2 nm or less. In practical terms, for molecules of pharmaceutical interest in solution, this bandwidth of 2 nm is considered adequate in also providing the required balance of high resolution while maintaining good S/N ratio.
However, it should be noted that nicotinic acid, which is shown to be acceptable for use as a photometric accuracy reference, does have transmittance characteristics that are highly correlated to the SBW, and therefore it is always necessary to match the SBW of the certified absorbance values to those of the instrument system being qualified.
Stray Light
Stray radiation, commonly referred to as stray light, can be defined as radiant energy at wavelengths other than those indicated by the monochromator setting and all radiant energy that reaches the detector without having passed through the sample or reference solutions (seeFigure 3). It may be caused by any scattered radiation from imperfections in the dispersing medium, which commonly is a grating. The use of a holographic grating substantially reduces the levels of this source of stray radiation. Higher-quality ruled gratings yield a low level of scattered radiation. In higher-performance instruments, stray radiation can be reduced by the use of double monochromators or double-pass monochromators. Stray radiation, or apparent stray radiation, also may be caused by light leaks in the system, incorrect wavelength calibration, incorrect optical alignment, reduced source output, or reduced detector response.
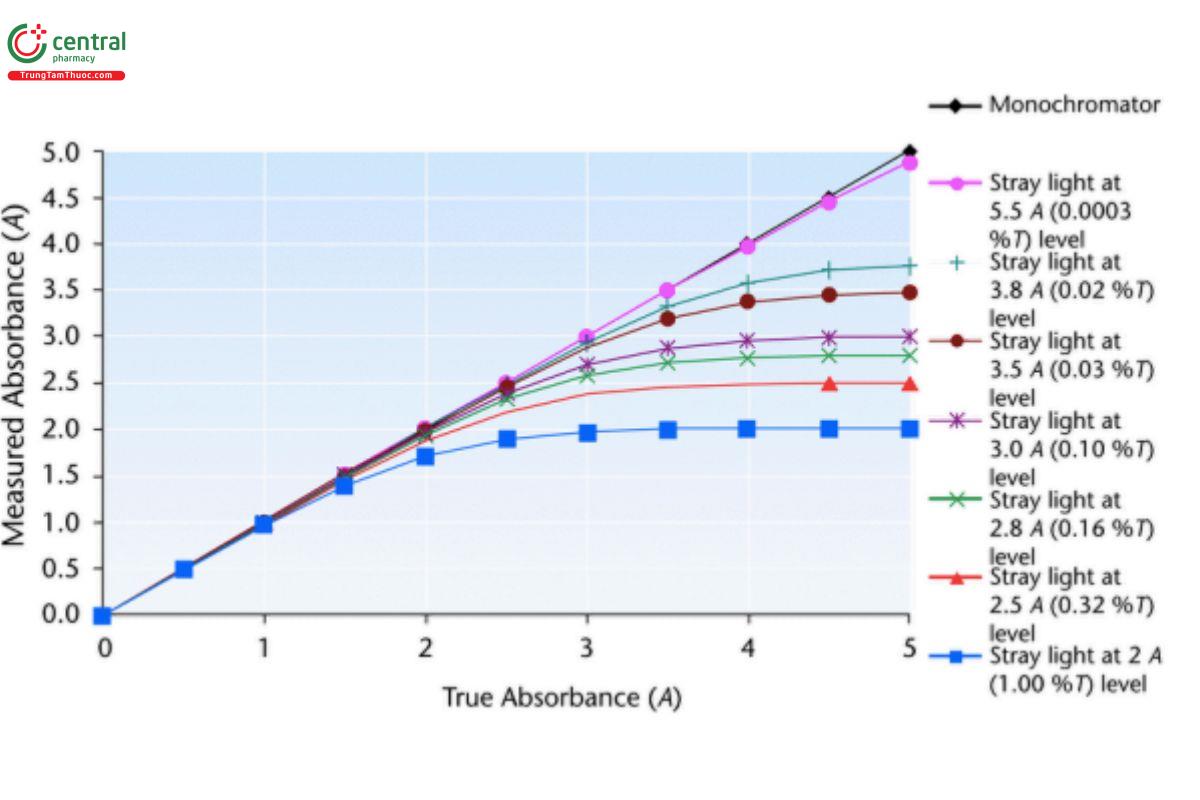
Figure 3. Effect of stray light on measured absorbance.
The usual way of assessing stray light is to measure, at the desired analytical wavelength, a sample that totally absorbs the radiation at that wavelength but transmits at all other wavelengths. Any light detected by the instrument is then stray light.
In 1982, Mielenz et al. at the National Institute of Standards and Technology (NIST) defined stray light as spurious radiant energy that has departed from its regular path in a spectrometer and then re-enters the path so that it is sensed by the detector and causes false readings of transmittance and absorbance. Mielenz also offered a renement on the estimation method in current use at the time. This method has since been incorporated into 〈857〉, qualification of UV-Vis Spectrometers, Estimation of the Limit of Stray Light (Stray Radiant Energy), Procedure A. In this method, the reference beam is attenuated by a 5-mm path length cuvette containing the same edge filter solution as used in a 10-mm path length cuvette placed in the sample beam. A maximum peak differential absorbance is observed (ΔA) while scanning through the edge absorbance, which is related empirically to the stray light level (s ) by:
sλ = 0.25 × 10⁻²ΔA
Table 1 provides a list of differential absorbance values, the "Mielenz measured absorbance", and their corresponding stray light levels. Table 1. Value Comparison Table and Critical "Mielenz" Measured (Differential) Absorbance Values
"Mielenz" Measured Absorbance(ΔA) | Stray light level, sλ , expressed as... | ||
Transmittance (T) | % Transmittance (%) | Absorbance (AU) | |
0.3 | 0.063 | 6.3 | 1.2 |
0.5 | 0.025 | 2.5 | 1.6 |
0.7 | 0.01 | 1.0 | 2.0 |
1.0 | 0.0025 | 0.25 | 2.6 |
1.5 | 0.00025 | 0.025 | 3.6 |
2.0 | 0.000025 | 0.0025 | 4.6 |
25 | 0.0000025 | 0.00025 | 5.6 |
This method therefore avoids the potentially difficult procedure (see 〈857〉, qualification of UV-Vis Spectrometers, Estimation of the Limit of Stray Light (Stray Radiant Energy), Procedure B) to nd appropriate attenuation filters in the UV region required to "back-off" the system, especially if using a modern double-monochromator spectrometer, and also avoids the measurement performed at the limit of the instrumental range and analog-to-digital electronic resolution. Figure 4 shows spectral proles acquired of a potassium chloride solution using both 〈857〉, Procedure A and 〈857〉, Procedure B.
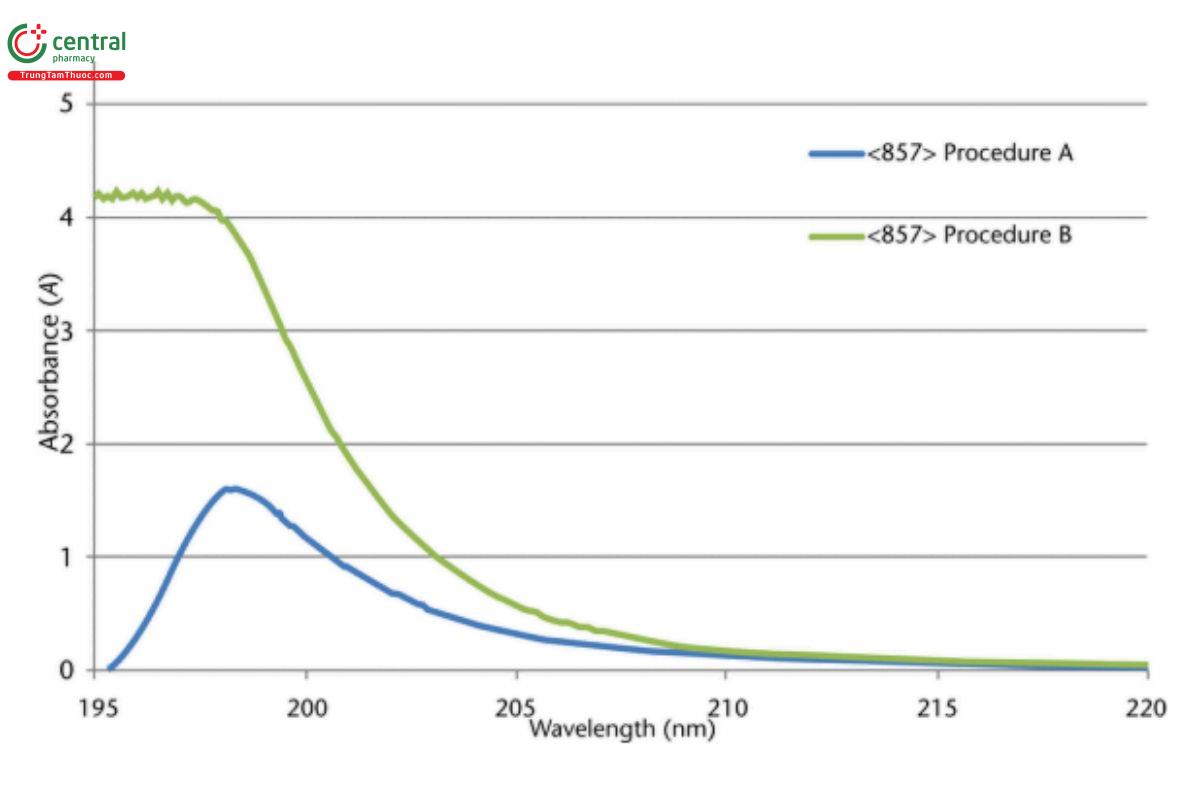
Figure 4. Typical spectrum of 1.2% aqueous potassium chloride vs. water as reference, 10-mm path length (Procedure B). Differential absorbance spectrum of 1.2% aqueous potassium chloride, 10-mm path length, vs. the same solution as reference, 5-mm path length (Procedure A).
Optimum Working Photometric Range
Determination of the optimum photometric range is fundamental to establishing the capability of a given instrument before and during method validation. The importance of this procedure can be shown by the fact that in 1945 Vandenbelt et al. attempted to establish the optimum absorbance range on the then-new Beckman DU spectrometer (1). They suggested a simple approach in which the molar A1%1 cm absorptivities of various compounds are measured at different concentrations. This approach is shown theoretically in Figure 5, where the center plateau is used to define the photometric range.
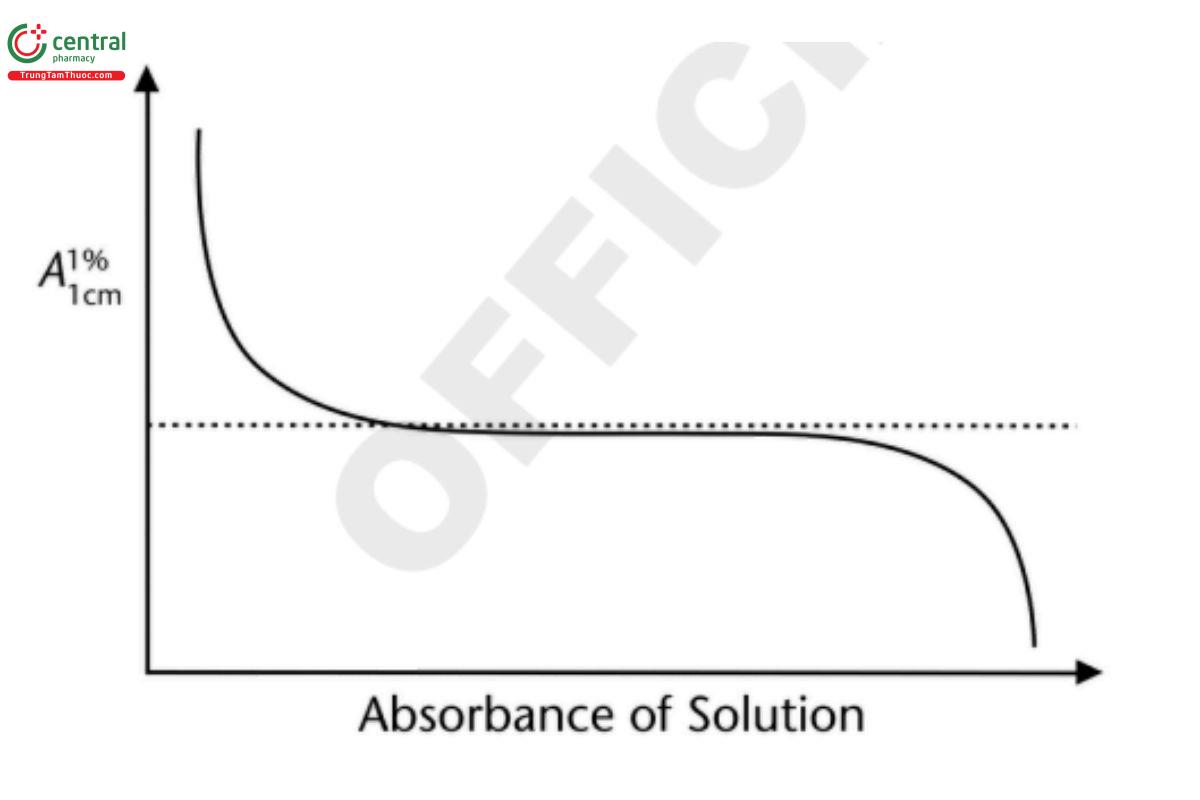
Figure 5. Theoretical photometric response curve.
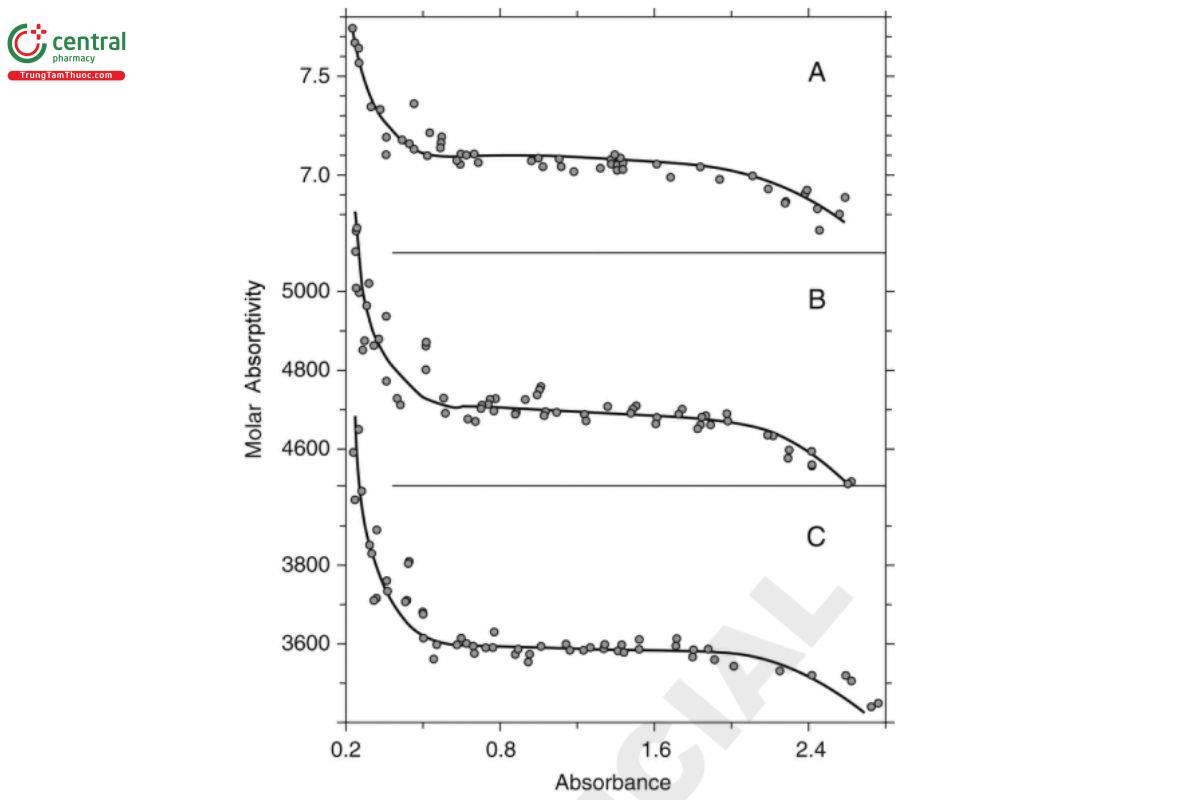
Figure 6. Molar absorptivity vs. absorbance for three solutions: A) aqueous potassium nitrate measured at 301 nm; B) potassium chromate in 50 mM potassium hydroxide at 373 nm; C) potassium chromate in 50 mM potassium hydroxide at 273 nm (2). A more rigorous method for estimating an instrument's region of maximum precision is given by Youmans and Brown (3). The error in the measurement of the concentration of a solution of transmission T can be expressed as:
Δc = 1/ϵb. log (Tav / Tmin)
where Δc is the change in concentration, ε is the molar absorptivity of the compound, b is the path length, and Tav and Tmin are the meanand minimum values, respectively, from a series of n measurements on the sample.
The statistical error is (see Figure 7):
Δc/c = 1/ -log (Tav) . log (Tav / Tmin)
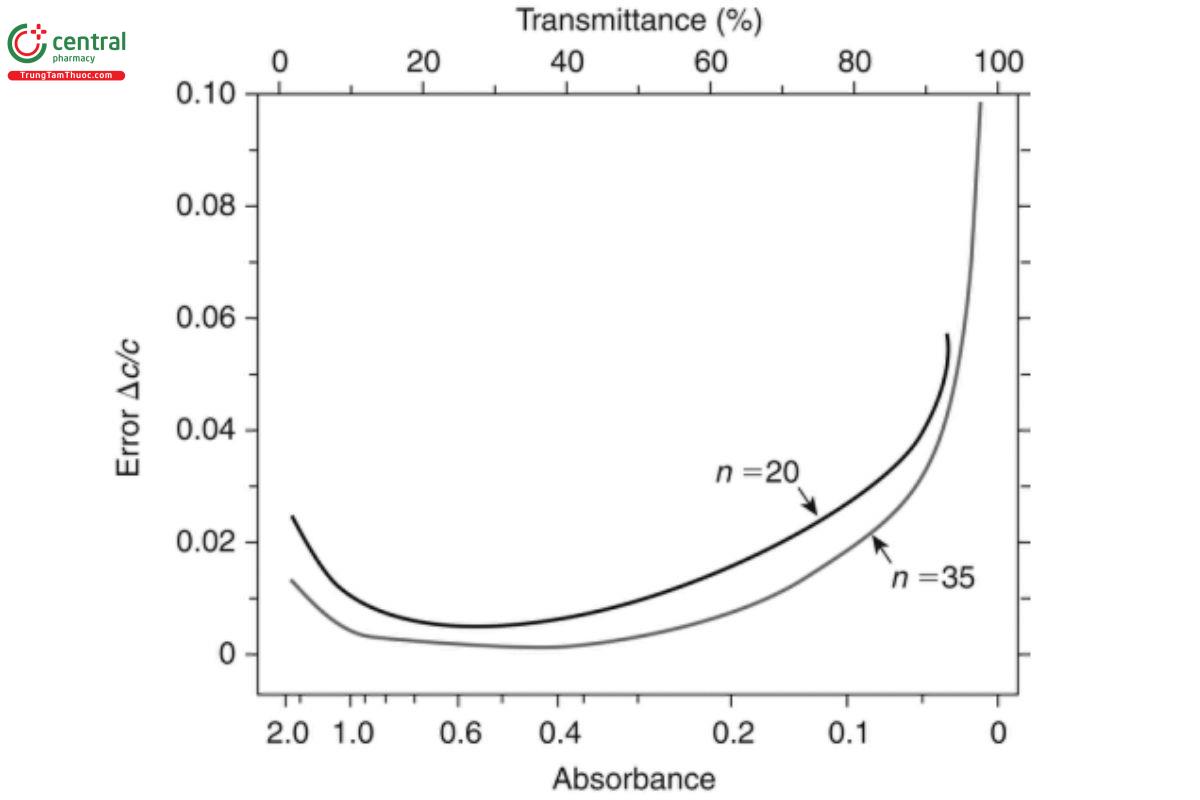
Figure 7. Youmans and Brown plot (2).
The noise levels, and hence the precision of measurement, depend primarily on detector noise type, as shown in Figure 8.
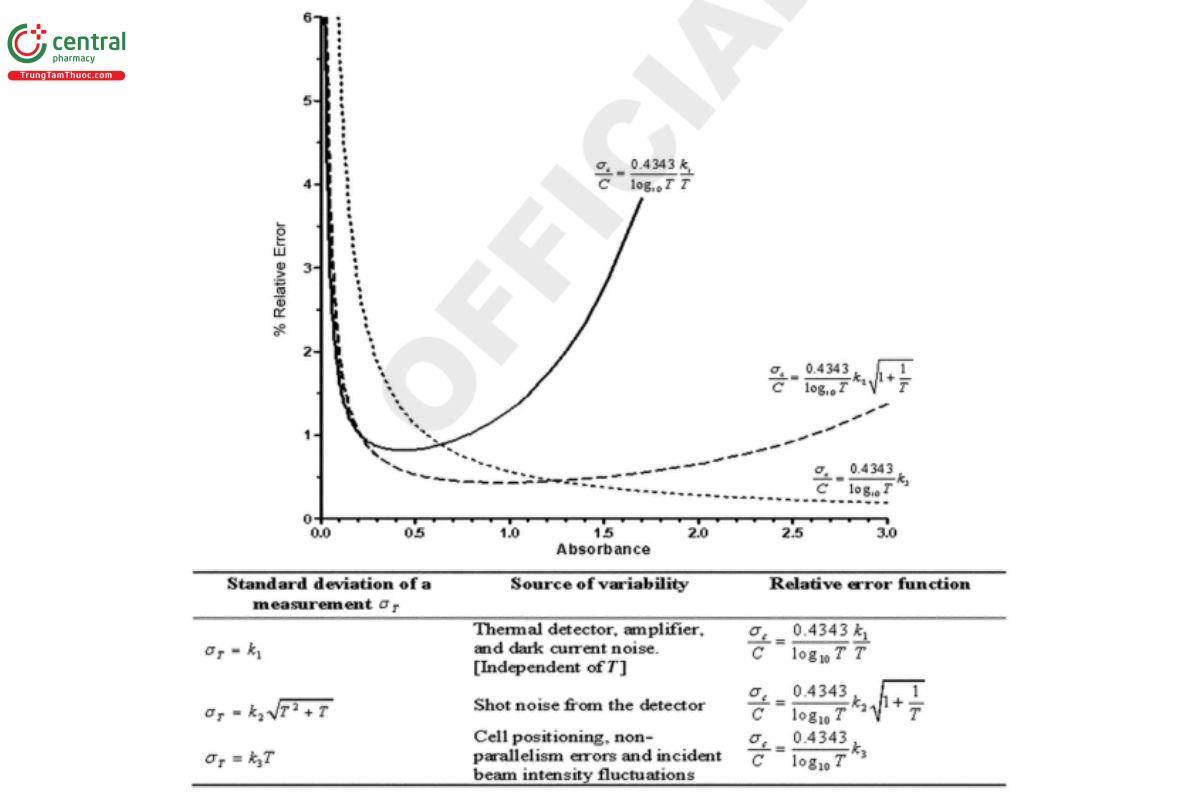
Figure 8. Measurement precision as a function of noise type (4).
Both approaches clearly show that in addition to the expected increasing error at higher absorbance levels caused by stray light and other factors, there is a similar, if not larger possibility for increasing error at low absorbance levels caused by instrumental variances in the form of noise from the detector, source, etc. This variance often is overlooked in the desire for economy of scale, when analysts use smaller samples and shorter path lengths and therefore lower measured absorbance values.
Good practice is to optimize the measured absorbance within 0.2–2.0 absorbance units (AU), where possible. In addition, the use of shorter path length cuvettes should be the preferred option to reduce a measured solution absorbance rather than the corresponding ratio dilution with solvent. Invariably, the path length tolerances on a modern manufactured cuvette are significantly smaller than those associated with volumetric glassware; and not diluting the sample avoids the risk of solution chemistry changes caused by dilution.
Change to read:
5 CALIBRATION
UV-Vis spectrometer calibration involves two components: primary wavelength (x-axis) and photometric scale (y-axis), and often is performed when the instrument is initialized. Most dispersive UV-Vis spectrometers use atomic emission lines from either the source or a secondary lamp for primary wavelength (x-axis) calibration, in addition to the zero-order position in the monochromator. How (and to what level of "user") these fundamental calibration procedures are made available will depend on the vendor's configuration of the instrument. Calibration of both the wavelength (x-axis) and the photometric scale (y-axis) is critical for successful quantitation and method transfer between instruments. In many cases, the effect of wavelength error in the x-axis can be minimized by the use of careful method selection, e.g., wavelength at a spectral peak. Although the fundamental measurement relies on a simple ratio measurement, modern instruments may use several gain settings or amplification factors to ensure a linear detector response, particularly at low intensity levels and high-power settings. These gain settings often are initially set by the manufacturer, but the settings may be recalibrated as the optics age or as other changes take place.
Detailed functional validation based on certified reference materials as detailed in 〈857〉 is recommended to demonstrate the suitability of laboratory instruments, even for instruments that possess an internal calibration capability. The use of external reference materials does not obviate the need for internal quality control procedures. Rather, it provides independent documentation of the fitness of the instrument to perform the specific analysis.
Change to read:
6 ANALYTICAL CONSIDERATIONS
Temperature and coefficient of Expansion Effects
Temperature impacts absorption measurements and, thereby, the photometric accuracy in several significant ways. Changes in temperature can induce expansion or contraction of the solvent, leading to lower or higher concentrations and absorbances. While this is a particular issue with some organic solvents, careful temperature control, i.e., within ±2° may be required where high-accuracy absorbance values are required for aqueous solutions, for example, to verify compliance with photometric value assignments stated for a reference material and/or calculation of a molar extinction coefficient. In 〈857〉, this accurate control of temperature is particularly important when liquid photometric accuracy references are being used in the qualification process, i.e., nicotinic acid and acidic potassium dichromate solutions. In such cases, additional temperature monitoring and/or control of the sample measurement process may be required. Also, shifts in equilibria between the chemical forms of an analyte may cause the nature of the absorbing species to be changed.
Solvent Selection Effects
Solvents play an important role in UV spectra. In a spectrum, the compound peak can be obscured by the solvent peak. So, a most suitable solvent is one that does not itself absorb and is transparent in the region under investigation. As a general rule, it should be possible to measure a solvent at the wavelength of interest at a transmittance value of >75%.
A dilute solution of sample is always prepared for analysis. See Table 2 for a list of most commonly used solvents. In this table, approximate wavelengths below which the solvent absorbance may be unacceptable are specified. For quantitative applications, the cut-off may be set at a wavelength (L1 ) where the absorbance for the 10-mm path length of the solvent exceeds 0.05 AU (relative to water), i.e., A 1 cm > 0.05 AU. For qualitative work, it may still be feasible to operate at significantly lower wavelengths; most analysts accept a cut-off based on the wavelength (L1 ) for A 1 cm > 1.0 AU.
Table 2. Solvent Cut-Off of Commonly Used Solvents
Solvent (Common Name) | L0 (nm) | L 1 (nm) |
Acetone | 340 | 330 |
Acetonitrile | 200 | 190 |
Isobutanol | 250 | 200 |
n-Butanol | 245 | 215 |
n-Butyl acetate | 275 | 255 |
Cyclopentane | 220 | 195 |
Decalin | 250 | 230 |
Dichloromethane | 245 | 230 |
Diethyl ether | 255 | 220 |
N,N-Dimethylformamide | 300 | 270 |
Dimethylsulfoxide | 330 | 285 |
Ethanol | 240 | 205 |
Ethyl acetate | 280 | 260 |
Heptane | 230 | 200 |
Hexane | 225 | 195 |
Methanol | 240 | 205 |
Isopropanol | 240 | 205 |
n-Propanol | 250 | 210 |
Tetrachloroethylene | 320 | 290 |
Tetrahydrofuran | 280 | 220 |
Water | 190 | 185 |
In addition, there are three other solvent related effects. First, dissolved gases may cause absorption at wavelengths above the pure solvent cut-off. For example, dissolved atmospheric gases may cause absorption to occur at 190–205 nm in an aqueous system. Second, organic solvents may contain other stabilizing chemicals that will absorb at higher wavelengths. Last, changes in physical solvent properties, e.g., polarity or degree of hydrogen bonding, may cause chromatographic shifts in the band spectrum. Sample-Based Factors
The most important sample-based factors that negatively affect quantitative UV-Vis spectrometry are fluorescence and light scattering. If the sample matrix includes fluorescent compounds, the measured signal usually will contain a contribution from fluorescence. The wavelength range and intensity of the fluorescence depend on the chemical composition of the fluorescent material. Suspended particles scatter light by the Tyndall effect, causing a decrease in the measured intensity that increases as the wavelength decreases. Unless there is no alternative, absorbance should not be determined on turbid samples. Procedures for removing turbidity include filtering, centrifuging, or occulating the sample and are performed before any additional procedures that generate a chromophore, provided that they do not affect the concentration of the analyte or the chromophore in the test solution. Any measurements performed on a turbid solution are highly instrument specific and can be used only for comparative purposes in the same system. A further complication can arise at higher analyte concentrations with respect to the coordination chemistry and system matrix. Ionic association, complex formation, and similar factors can cause deviation from the expected linear response.
Sampling Factors
SOLUTION PREPARATION
As previously stated, all solutions used for measurement should be particle free and prepared as accurately as possible. The errors associated with any solution preparation can be minimized by ensuring that all gravimetric processes are used within the center median of the given working range of the balance(s) and that a gravimetric process, in preference to a volumetric process, is used for all subsequent required dilutions. Again, the use of reduced path length cuvettes should be chosen in preference to an additional dilution step.
CUVETTES
Quantitative absorbance measurements usually are made on solutions of the substance in liquid-holding cuvettes. The most common cuvette path length is 10 mm, although path lengths from 0.01–100 mm are commercially available (see Figure 9). For samples with low absorbance, improved sensitivity generally can be obtained by increasing the cuvette path length. For example, the theoretical absorbance of a solution in a 50-mm cuvette is greater by a factor of 5 compared to the same solution in a 10-mm cuvette. Errors in absorption readings arising from cuvettes almost always are caused by dirty windows that can absorb a significant proportion of the incident light beam. Less frequent causes of error are an incorrect choice of cuvette material for the wavelength required, e.g., use of glass cuvettes less than 320 nm, nonrepeatability of cuvette positioning, differences in cuvette window thickness, nonparallel optical windows, or impurities in cuvette window materials. A 10-mm cuvette manufactured with a ±0.05 mm tolerance will add a 0.005 AU contribution to the overall uncertainty, when measuring absorbance values at the 1 AU level. There are 10-mm cuvettes with a ±0.01 mm tolerance commercially available. As a general guide, the cuvette chosen should have a transmittance value of >75% when filled with the appropriate solvent, as previously discussed, and measured at the wavelength of interest.
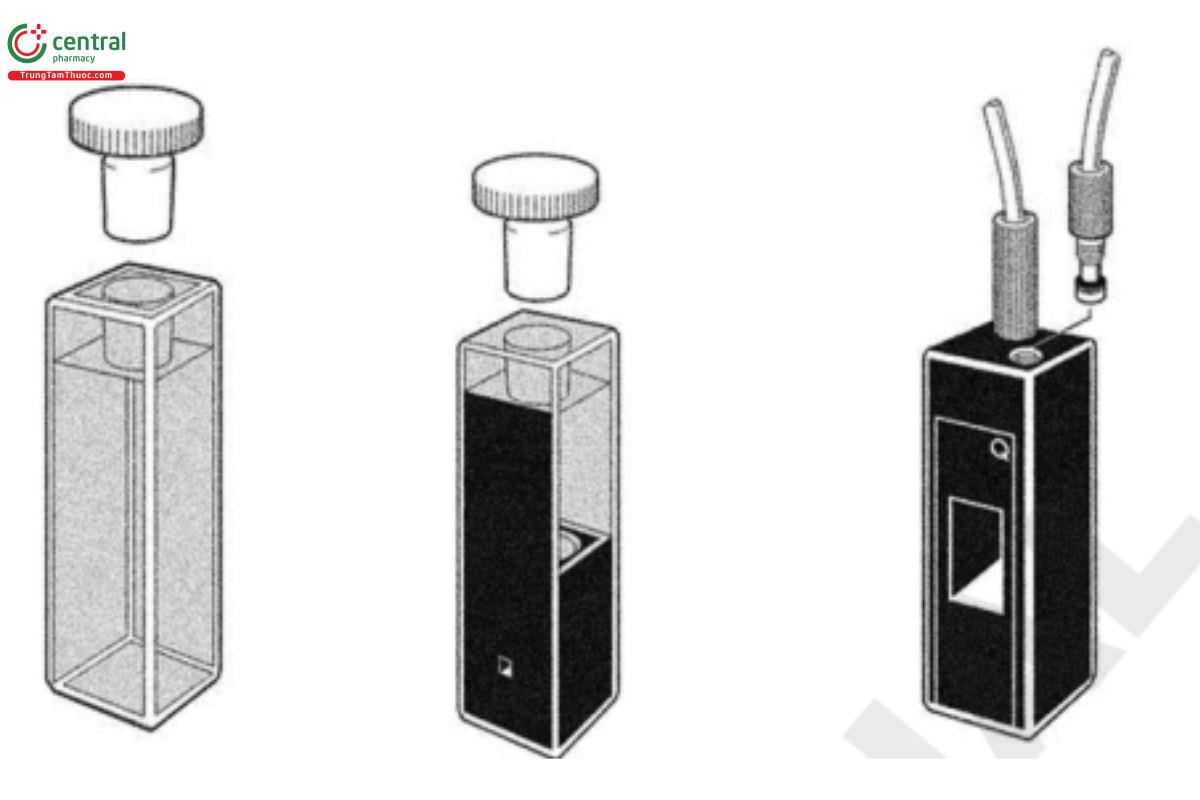
Figure 9. Commonly used cuvette types: 10-mm regular, low-volume, and flow cuvettes (from left to right).
Analysts can mitigate the variability introduced by cuvettes by adhering to the following set of best practices. Carefully clean cuvettes before use, and store them in a manner that avoids contamination when they are not in use. Cuvettes in frequent and repeated use, e.g., flow cuvettes, can be stored wet in high-purity water or 1% (v/v) nitric acid. Do not use cracked or scratched cuvettes. Wipe cuvettes carefully with a soft, clean, lint-free cloth before they are placed in the spectrometer. Do not use lens-cleaning paper or any other form of paper cleaning tissue because these will either scratch or allow contamination of the optical face.
It is preferable to use a single cuvette for all measurements of both the reference and samples, and where possible, never move the cuvette if you can move the solution. Liquid transfer should be made using plastic-tipped devices to avoid scratching the optical surfaces. This approach, which eliminates interreection errors and nonparallelism effects, should always be used if work of the highest accuracy is needed. The use of a flow cuvette with peristaltic aspiration is recommended. When several sample cuvettes must be tested against one reference cuvette, they all should be closely matched in their characteristics. Whenever possible, measure standards and samples at the same time and under the same conditions to minimize the potential for bias. The reference cuvette should contain the same solvent as the sample cuvette and should be checked against the sample cuvette at all wavelengths for which measurements are required. Analysts can apply corrections for differences between cuvettes to absorbance readings obtained from the solutions under examination. The maximum allowable correction is ±0.01 AU. Best practices include using the same cuvette in the reference beam with the same face incident to the light beam, and flushing the sample cuvette three times with the sample solution before the nal filling before measurement. When solutions using volatile solvents are to be measured, it is advisable to use polytetrafluoroethylene (PTFE) stoppered-cuvettes, ideally one of the many screw-capped variants available. The use of flow cuvettes effectively addresses many of these handling and filling issues. The contents in both the sample cuvette and the reference cuvette must be free from gas bubbles and particles. If flow cuvettes are used, analysts may be required to degas the solution(s) before measurement in order to avoid the formation of air bubbles in the cuvette.
A sequence of activities is used to monitor the quality of the measurement process and to ensure that the contents are representative of the sample under measurement. Drift of the spectrometric baseline can be detected by measuring the blank at the start and end of the sample sequence and also at interim points if the time scale requires them. Adequate flushing of the cuvette can be confirmed by alternating between measurement of the standard (high concentration) and the blank (zero concentration) at the start of the measurement sequence. The latter check is particularly important for automated systems that can generate reproducible but inaccurate results because of inadequate flushing.
CARE OF CUVETTES
Contaminated cuvettes are the greatest single source of error in UV-Vis spectrometry. Cuvettes should never be handled by the optical polished faces, and analysts should rinse off residual or spilled solution. If cuvettes (USP 1-Dec 2022) are properly cared for, rigorous cleaning methods rarely will be needed, especially if the cuvettes are cleaned immediately after use. Although acid solutions will simply contaminate surfaces, alkaline solutions can etch all types of polished glass surfaces, and the degree of attack depends on the pH and contact time. When cleaning cuvettes, analysts should ensure that the optical faces are not scratched or chipped. Commercial cleansing solutions are available and can be used, provided that they are diluted before use in accordance with the manufacturers' recommendations. After they are cleaned with such agents, the cuvettes should be carefully and thoroughly rinsed with high-purity water. If this fails to clean the cuvettes, then soaking
them in cold, concentrated nitric or hydrochloric acid is acceptable. Flow cuvettes are best cleaned in situ, provided that the solvent does not interact with the connecting tubing. If the cuvettes are stored for an extended period, then they should be dried quickly after cleaning by blowing dry with a compressed gas stream in a clean, dust-free environment. Many laboratory "compressed air gas lines" may contain lubricating oil from the machinery and thereby deposit a lm of oil on the optical face. (USP 1-Dec 2022)
ALIGNMENT AND FILLING OF CUVETTES
Analysts should align the cuvettes so that the same optical face is always incident to the light beam. Most cuvettes have type identification engraved on one face; this can be used to ensure consistent orientation. If there are no markings, a small mark can be made on one face outside the area of the light beam. The use of cuvettes with no type markings is not recommended, but, if cuvettes with type markings are used, analysts should confirm their suitability for the intended application. If cuvettes are provided with the instrument, individual cuvette holders should always be used in the same beam as identified, e.g., by use of appropriate markings.
CUVETTE CORRECTIONS
If multiple cuvettes are used, differences in the optical transparency of individual cuvettes can introduce a systematic bias unless the latter is accounted for by a cuvette correction. Depending on where the zero point is set, this correction can be either positive or negative; however, do not use corrections in excess of 0.01 AU. To determine if cuvette corrections are necessary, analysts can fill all cuvettes with the appropriate solvent and measure the differences in absorbance at the required analytical wavelengths. These measurements are repeated after cleaning to ensure that differences in absorbance are related to the cuvettes and are not the result of contamination. Analysts should fill and check the cuvettes repeatedly until the results are consistent, and they should investigate any appreciable change in cuvette correction because it indicates contamination, damage to the cuvettes, or incorrect adjustment of the instrument.
7 APPENDIX
Other Sources of Information
- Vandenbelt J M, Forsyth J, and Garrett A. Anal. Chem. (Industrial and Engineering Chemistry, Analytical Edition). 1945;17(4):235.
- Burgess C, Frost T (Eds.). Standards and Best Practice in Absorption Spectrometry. Blackwell Science; 1999. ISBN 0-632-05313-5.
- Youmans HL, Brown WD. Anal. Chem. 1976;48:1152.
- Skoog DA, West DM, Holler FJ. Fundamentals of Analytical Chemistry. 7th ed.; 1996: Table 24-4.
