Theory and Practice of Asbestos Detection in Pharmaceutical Talc
If you find any inaccurate information, please let us know by providing your feedback here


Tóm tắt nội dung
This article is compiled based on the United States Pharmacopeia (USP) – 2025 Edition
Issued and maintained by the United States Pharmacopeial Convention (USP)
1 INTRODUCTION
This chapter provides background information to support Detection of Asbestos in Pharmaceutical Talc 〈901〉. It describes analytical procedures for X-ray diffraction (XRD)—also termed X-ray powder diffraction (XRPD)—and polarized light microscopy (PLM), both of which can be effective for testing of asbestos in talc. Some of the principles applied in this method were first described in the J4-1 method developed by the Cosmetics, Toiletries, and Fragrance Association (CTFA)(1) and applied to the analysis of talc for asbestos, which was implemented in 1976, although the method applied only to the analysis of amphibole asbestos. The original asbestos test, which was added to the Talc monograph in 2005, expanded on this protocol, applying the principles to chrysotile and amphibole asbestos. For a full description of the current update to this procedure, see the related USP publication (2).
XRD in combination with PLM and/or an electron microscopy technique, such as transmission electron microscopy (TEM) or scanning electron microscopy (SEM), can ensure adequate specificity of the asbestos test because definitive microscopic identification and characterization of asbestos and mineral fibers are critical to detect the presence or confirm the absence of asbestos. Specificity encompasses a determination of a particle’s mineral identity and whether or not the mineral is asbestiform. This can only be accomplished definitively by microscopy.
As with all of the techniques discussed for asbestos analysis, XRD should not be used alone for asbestos determination, as XRD cannot distinguish morphology and therefore cannot be used exclusively to determine whether amphibole or serpentine are asbestiform or nonasbestiform. However, XRD is critical for the identification of phases present in a mineral mixture and can also determine if foreign materials are present.
Both XRD and PLM allow for testing of larger sample amounts than electron microscopic methods, leading to more representative analyses in general. The largest amount of material can be analyzed in the XRD test, followed by PLM, SEM, and TEM.
The asbestos testing methods for pharmaceutical talc—including XRD, PLM, SEM, and TEM—are compared in Table 1.
Table 1. Methods for Asbestos Detection and Quantification in a Talc Matrix
XRD in combination with PLM can be effective in the characterization of asbestos particles in the >5-µm size range, and PLM has, as its strength, the ability to distinguish asbestiform from nonasbestiform particles. While electron microscopy techniques such as TEM and SEM have the ability to analyze particle sizes that are below the resolution limit of optical microscopy, optical microscopy has sufficient resolution to cover the majority of the size range in coarser pharmaceutical products (e.g., 200 mesh) and a significant portion of the finest products (i.e., <325 mesh). Furthermore, due to the high tensile strength associated with asbestos and the higher hardness of serpentine and amphibole minerals relative to talc—the softest mineral known—asbestos, if present, is not likely to occur solely as individual particles in the finest size range of a milled talc−asbestos mixture, but rather as larger particles and bundles, due to resistance to grinding. This was demonstrated during round robin testing, where spiked samples were prepared using aggressive grinding to simulate production of ground product. Even though the samples were ground, asbestos bundles were still present and identifiable by PLM (3).
2 PROCEDURE 1: X-RAY DIFFRACTION
XRD is used to determine whether amphibole and/or serpentine are present in a talc powder matrix, and when applicable, to estimate the percentage present. It is intended to be used in combination with one or more microscopy techniques capable of determining whether asbestos is present. XRD is the initial analysis in the monograph asbestos testing and is an important tool for mineral or material characterization.
XRD can be used to determine overall purity of a talc product with respect to accessory minerals and is important in determining the suitability of talc for pharmaceutical use. Depending on a talc’s formation conditions, accessory minerals include, but are not limited to, dolomite, magnesite, calcite, and quartz, as well as a variety of micas, chlorites, feldspars, and sometimes serpentines and amphiboles.
Chlorite group, feldspars, and dolomite minerals can interfere with the detection of serpentine group minerals during analysis. Refer to Table 2 in Appendix 1, which includes XRD peak positions for talc and minerals that can be associated with talc as well as critical interferences. An example of an XRD qualitative scan of talc (used as the base material for reference material spikes) is included in Appendix 2.
This test method uses XRD to detect and identify the presence of total amphiboles and total serpentine in a powdered talc product. [NOTE— XRD cannot distinguish between asbestiform and nonasbestiform varieties of amphibole or serpentine and therefore on its own cannot detect if asbestos is present. XRD can, however, detect whether serpentine or amphibole minerals are present and provide information about their upper limits of occurrence.] XRD can also indicate the presence of foreign substances.
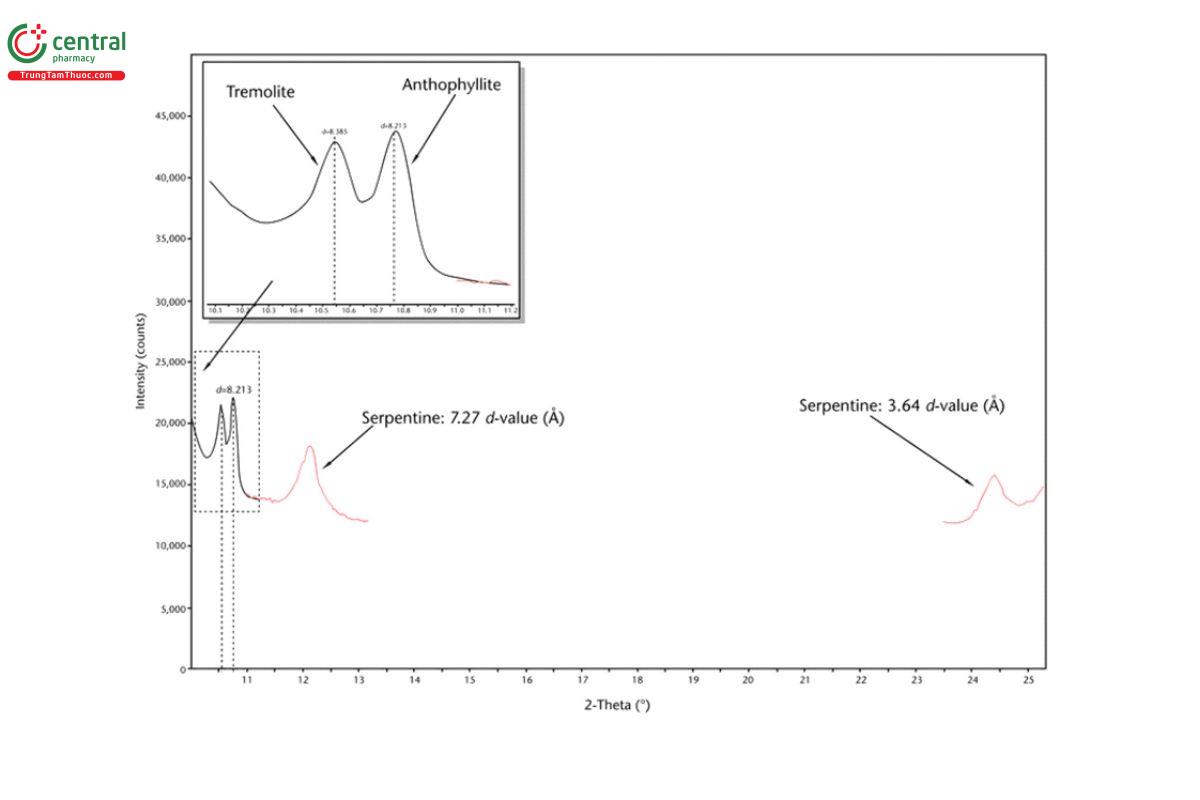
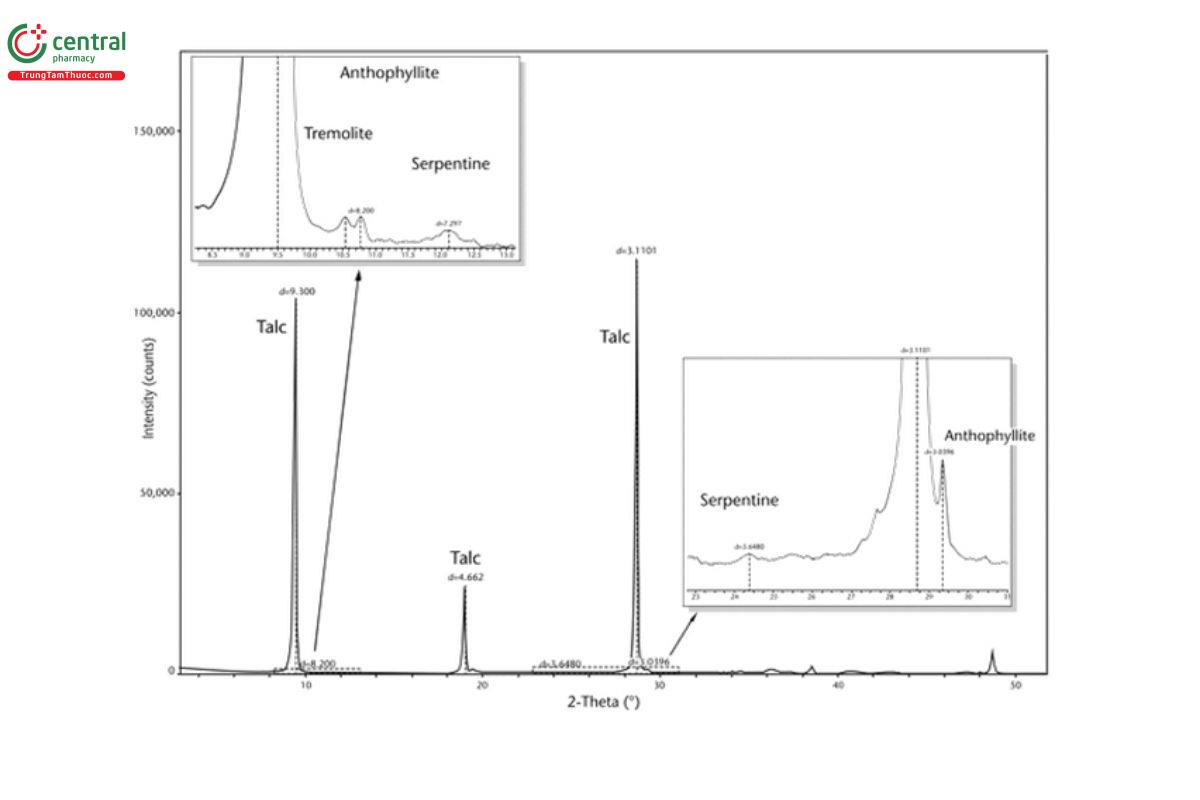
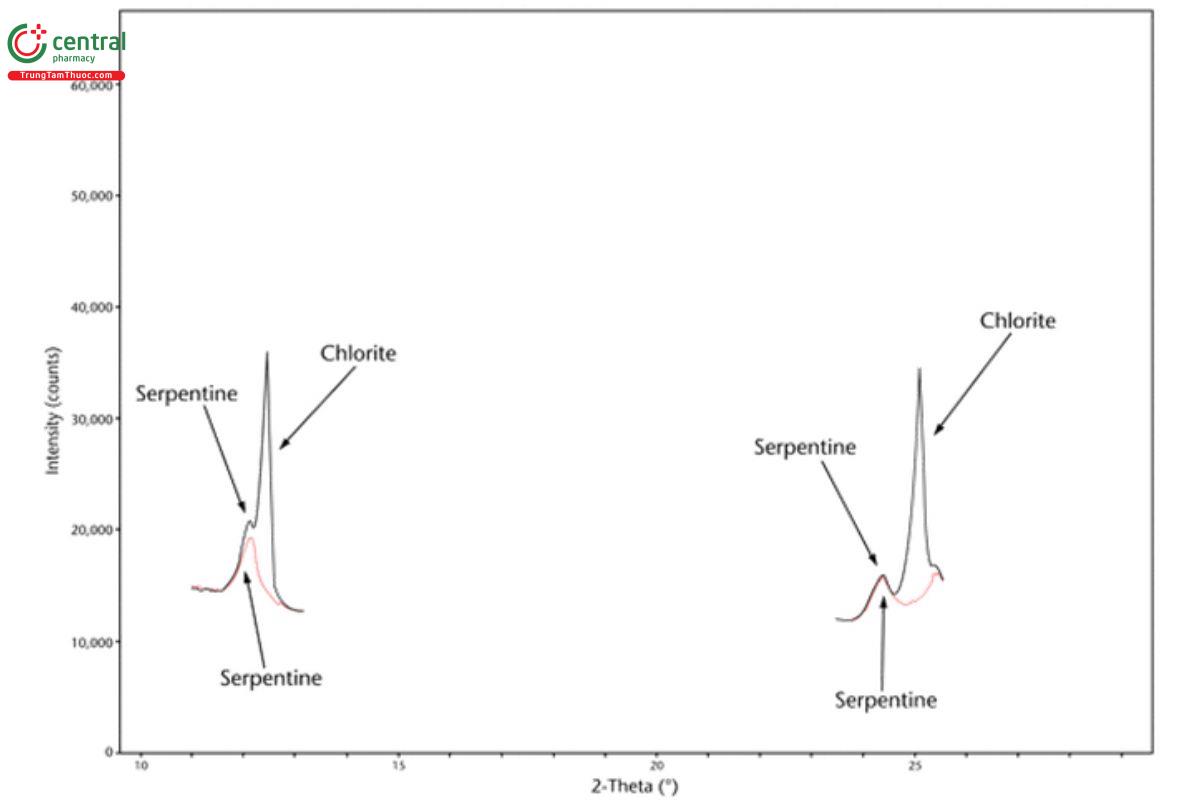
For monoclinic amphiboles (e.g., tremolite, actinolite), the primary diagnostic peak is at approximately 10.5° 2-theta (2θ), and for orthorhombic amphiboles (specifically anthophyllite), the primary diagnostic peak is at approximately 10.7° 2θ with copper Kα radiation. Refer to Appendix 2 for examples of quantitative XRD scans of talc spiked with 1% tremolite, 1% anthophyllite, and 1% chrysotile showing peak positions for these minerals. For serpentine group minerals, partial or full overlap of peaks from chlorite group minerals can occur (i.e., serpentine diagnostic peaks at 12.1° 2θ and 24.4° 2θ can overlap with chlorite diagnostic peaks at 12.5° 2θ and 25.1° 2θ, respectively). For this method, an amphibole reporting limit of detection has been empirically determined to be 0.2%. However, a lower limit of detection for amphiboles can be attained at 0.1%, as verified by an individual laboratory. For this method, a serpentine limit of detection has been determined to be 0.2% with no chlorite interference and 1% with up to 15% chlorite interference. Appendix 2 includes examples of quantitative XRD scans of talc spiked with 1% serpentine and 1% chlorite to illustrate the potential interference of these two minerals.
[NOTE—XRD evaluations of amphibole and serpentine minerals may have compositional variation or inherent crystallinity variation or combinations thereof that can be observed through slight shifts in d-values and associated peak profile variations associated with full width half maximums (FWHM).]
XRD findings on potential total amphibole or total serpentine content should be consistent with the findings from PLM and any additional microscopic techniques. For example, PLM would not be expected to exhibit percentages of amphibole or serpentine if XRD did not detect them above the detection limit.
When used under quantitative scan conditions specific to this test method, XRD can also be used to determine a relative detection limit of total amphibole and total serpentine minerals in a pharmaceutical talc product. XRD analysis, with respect to asbestos screening of bulk materials, is also discussed in the Environmental Protection Agency's (EPA/600/R-93/116) and the International Organization for Standardization's (ISO 22262-3)(4) methods.
For background information about talc, amphibole, and serpentine group minerals, see the relevant USP publication (2).
2.1 Detection Limit
An XRD round robin study using samples prepared with known amphibole and serpentine amounts was completed to determine a relative limit of detection for amphiboles (tremolite and anthophyllite), serpentine with no chlorite interference, and serpentine with trace levels of chlorite interference (2). Samples included the following:
1% tremolite nonasbestiform
1% anthophyllite asbestiform (A-181; as received)
1% serpentine—chrysotile (#1422 WCD, as received)
0.25% tremolite nonasbestiform
0.25% anthophyllite asbestiform (A-181; as received)
0.25% serpentine—chrysotile (#1422 WCD, as received)
1% serpentine—chrysotile (#1422 WCD, as received) 1% chlorite (highly crystalline spike, fine powder)
Baseline talc (no chlorite, no carbonates, macro-crystalline talc)
Based on these round robin evaluations, the method provided the following:
Acceptable resolution and detection of tremolite and anthophyllite at a concentration of 0.2% Easily resolved and detected tremolite and anthophyllite at a concentration of 1%
Acceptable detection of serpentine at a concentration of 0.2% without chlorite interference Easily detected serpentine at a concentration of 1% without chlorite interference
Acceptable resolution and detection of serpentine at a concentration of 1% with a chlorite level of up to 15%–20%
Individual laboratories should confirm that these detection limits (or lower) can be achieved by using similar (or lower concentration) spiked standards.
The instrument, equipment, apparatus, and supplies—as well as radiation safety—are described in Characterization of Crystalline and Partially Crystalline Solids by X-Ray Powder Diffraction (XRPD) 〈941〉.
2.2 Lab Testing Considerations
The lab should be capable of implementing a cGMP-based quality program as described in 〈941〉. The use of one or more of the recommended National Institute of Standards and Technology (NIST) XRD reference materials (e.g., NIST SRM 640c–Si) noted in Appendix 4 should be used to check the alignment of the instrument and sample as follows:
Instrument alignment: A condition where the geometry of the goniometer and sample stage are ideal, and analysis will generate an accurate d-value
Sample alignment: A condition where the specimen surface lies on the sample stage within the geometric focal plane of the goniometer and in conjunction with the instrument alignment, providing the most-precise and accurate d-values
It is helpful to run talc standards to become familiar with peak positions. Certified reference materials (or other noncertified talc samples) can be obtained for this purpose (see Appendix 4.) A list of peak positions for talc and common materials associated with talc is included in Appendix 2.
2.3 Further Information
For more information on XRD procedures, laboratories should have access to either Elements of X-Ray Diffraction (5)—which covers fundamentals, experimental methods, and applications—or X-ray Diffraction Procedures: for Polycrystalline and Amorphous Materials (6 ), which provides an effective guide to the science and practical techniques of geometrical crystallography and XRD of crystals as well as more complete coverage of space lattices, point and space groups, production and measurement of X-rays, powder techniques, other related topics, and additional references.
3 PROCEDURE 2: POLARIZED LIGHT MICROSCOPY
PLM is a transmitted light microscopic technique where optical properties of minerals can be measured and definitively identified with respect to mineral phase. Estimates of content can also be determined. PLM is described in detail in several publications (7–9 ).
Using standard immersion methods with PLM has three methodological strengths. First, the refractive indices (RIs) of the asbestos minerals of concern (e.g., chrysotile, anthophyllite-asbestos, tremolite-asbestos, or actinolite-asbestos) differ from talc such that individual particle identification is possible. This is especially true for the distinction of anthophyllite versus talc, which by other methods may be problematic. Second, tens of thousands of particles can be observed for selected optical properties in a relatively short time. Third, the morphology of each particle can also be determined.
Another technique, dispersion staining, is used to screen for particles of interest based on their color in dispersion staining mode. Dispersion staining is a specific configuration of the microscope, not a physical staining technique of the particles. When the RIs of the mineral and liquid are similar, the RI of the mineral can be estimated using this technique. Alternatively, additional preparations using more RI liquids can be used to determine a more precise value. A heating and cooling stage (optional for this method and discussed below) can also be used to vary the RI liquid values to determine matching indices of the phases analyzed more precisely.
Compared to Optical Microscopy 〈776〉, the addition of polarized light techniques described in this chapter, along with RI screening by dispersion staining, facilitates particle phase identification.
The PLM technique described below and in 〈901〉 involves a wet sieving preparation procedure to evaluate the coarser particles in the mineral powder matrix. This technique takes advantage of the tendency of talc to have a much finer particle size than harder mineral particles in a ground mineral mixture because talc is softer than all other minerals (Moh’s hardness of 1 on a 1–10 scale). This causes minerals that are more difficult to grind to concentrate in the coarser size fraction of mixtures containing talc. This is further enhanced by the fact that asbestos is characteristically difficult to grind due to its inherent tensile strength, especially relative to talc. This concept is readily confirmed by attempting to grind asbestos standards using a mortar and pestle. Therefore, enhanced separation of asbestos particles from talc is achieved with wet sieving by removing talc (the main component) from the matrix. Enhanced separation of nonasbestos particles of serpentine and amphibole is also achieved due to differences in their hardness (Moh's hardness of 5–6 versus 1, respectively), allowing for a more complete evaluation of morphology of the remaining phases. An added benefit of wet sieving is the removal of fine particles that are too small to be characterized by optical methods and act to dilute the sample.
The dispersion staining method applied to the analysis of chrysotile in talc involves immersing the particles in an RI liquid of 1.550. In the dispersion staining configuration of the PLM with the 1.550 RI liquid, talc plates appear yellow during the entire rotation of the stage. Edge- view talc appears yellow when the particle is oriented with its direction of elongation parallel to the microscope polarizer (n parallel) and blue when the particle is oriented with its direction of elongation perpendicular to the microscope polarizer (n perpendicular). In contrast, chrysotile is easily distinguished from talc, appearing magenta in the n-parallel orientation and blue in the n-perpendicular orientation. See Appendix 3 for an example image of chrysotile with talc in a 1.550 RI liquid.
The dispersion staining method applied to the analysis of amphibole in talc involves immersing the particles in an RI liquid of 1.605. In the dispersion staining configuration of the PLM with the 1.605 RI liquid, talc plates and edge-view talc appear pale blue to white during the entire rotation of the stage. In contrast, amphibole is easily distinguished from talc, appearing yellow when the particle is oriented with its direction of elongation parallel to the microscope polarizer (n-parallel) and a deep blue, magenta, or yellow when the particle is oriented with its direction of elongation perpendicular to the microscope polarizer (n-perpendicular). Refer to Appendix 3 for an example image of tremolite with talc in a 1.605 RI liquid.
The 1.605 RI liquid is used to screen for the presence of amphibole in talc. It will be incapable of measuring the gamma prime (ɣ′) RI of any amphibole and thus alone cannot be used to identify the mineral species; in some cases, the RIs and thus the colors observed are common across multiple amphiboles.
Use the appropriate matching RI liquid(s) specified in Table 2 of 〈901〉, for suspected amphiboles that may not be conclusive in the dispersion staining screening step (e.g., amphiboles with both RIs significantly higher than 1.605).
The wavelength of match can be determined using dispersion staining charts in Annex C of ISO 22262-1 (10) or Becke lines, as shown in Figure 2 of Gunter (11). RIs can be determined from the wavelength of match using references (7,12–13). Ranges of RIs for the amphibole minerals can be found elsewhere (9 ,14–15). A table of typical RI ranges for the regulated asbestos types can be found in EPA/600/R-93/116, Table 2-2 Optical Properties of Asbestos Fibers (16 ).
Optionally, a heating and cooling stage can be used to determine RI more precisely. In this method, the heating and cooling stage can be used with 1.595 RI liquid in plane-polarized light (PPL), cross-polarized light (XPL), and cross-polarized light with the first-order red plate (RPL), starting at room temperature. Scan the entire slide using medium to high magnification. The advantage of using this stage is that one
RI liquid can achieve a range of RIs at different temperatures (e.g., when using 1.595 RI liquid, the RI at 125° = 1.551, 50° = 1.584, and 0° = 1.606). For better identification, this procedure can be used to match the RIs of the mineral more precisely.
3.1 Detection Limit
It has been determined empirically that the working detection limit of this method is 0.01%, or 100 ppm by weight (µg/g). This was established in an interlaboratory test involving five laboratories and standards with known concentrations (3). In some cases, a concentration of 0.001%, or 10 ppm (µg/g), was detected, although this was not achieved consistently using the average amount of material analyzed at each laboratory. Individual laboratories can establish alternative detection limits if they are validated using standards of known composition.
3.2 Quantitation
Although quantification of results is not required in 〈 901〉, the following is an optional quantification method using the dimensions of particles documented during analysis:
Calculate the mass of asbestos, m, in grams:
Result = l × w2 × f × ρ × 10−12
l = length (μm)
w = width (μm)
f = shape factor (0.7854 for chrysotile; 0.5 for amphibole) [refer to ISO 22262-2 (17)]
ρ = density (mg/m3)
Calculate the total asbestos mass observed for all slides by summing the mass of each asbestos particle, m , in grams. Calculate the total mass of the sample analyzed by summing the mass of sample placed on each slide, m , in grams.
Calculate the total fiber mass as a percentage:
Result = mT/mA × 100
[NOTE—When quantitating the portion retained on a sieve (following wet sieve preparation), the above calculation applies only to the size fraction analyzed.]
3.3 Lab Testing Considerations
It is helpful to ensure that the microscope is set up and aligned properly by obtaining dispersion staining colors on prepared standards of amphibole and chrysotile asbestos before analyzing unknown material.
An analyst performing this method should have training specific to PLM and the various modes of PLM operation and must have a rigorous working knowledge of all terms described.
An example of a quality control program relating to PLM analysis can be found in EPA/600/R-93/116, Section 3.0 (16 ).
3.4 Standards and Calibration
NIST or NIST-traceable standards should be used for all types of asbestos, both common and uncommon asbestos types (the six regulated species), as well as interfering minerals and talc itself. [NOTE—Other characterized standards may be used as well, such as those provided by the National Institute of Environmental Health Sciences (NIEHS) or the Union for International Cancer Control (UICC).] Mounting media calibration (RI liquids):
Calibrate upon opening a new bottle from the manufacturer and quarterly thereafter for RI liquids that are used on a regular basis (e.g., 1.550, 1.605)
Calibrate infrequently used liquids before each use
Perform calibration using either NIST-traceable reference particles (e.g., Cargille precision optical glass) or an Abbe refractometer calibrated with a similar NIST-traceable standard
4 REFERENCES
1. Cosmetics, Toiletries, and Fragrance Association (CTFA) now known as the Personal Care Products Council (PCPC). https://www.personalcarecouncil.org.
2. Block LH, Beckers D, Ferret J, Meeker GP, Miller A, Osterberg RE, et al. Modernization of asbestos testing in USP Talc. In: Pharm Forum. Rockville, MD: USP; 2014;40(4).
3. Rutstein M, Pier J, Crane D, Gunter M, Halterman D, Houck K, et al. Modernization of asbestos testing in USP Talc—part 2. In: Pharm Forum. Rockville, MD: USP; 2020;46(5).
4. International Organization for Standardization (ISO). Air quality—Bulk materials—Part 3: Quantitative determination of asbestos by X-ray diffraction method. ISO 22262-3:2016.
5. Cullity BD, Stock SR. Elements of X-Ray Diffraction. 3rd ed. Upper Saddle River, NJ: Prentice-Hall; 2001.
6. Klug H, Alexander L. X-ray Diffraction Procedures: for Polycrystalline and Amorphous Materials. 2nd ed. New York: John Wiley and Sons; 1974.
7. Bloss FD. Optical Crystallography. Washington, DC: Mineralogical Society of America; 1999.
8. Dyar MD, Gunter ME. Mineralogy and Optical Mineralogy. Chantilly, VA: Mineralogical Society of America; 2019.
9. Nesse WD. Introduction to Optical Mineralogy. 4th ed. Oxford University Press; 2013.
10. International Organization for Standardization (ISO). Air quality—Bulk materials—Part 1: Sampling and qualitative determination of asbestos in commercial bulk materials. ISO 22262-1:2012.
11. Gunter ME. MSA at 100 and why optical mineralogy still matters: the optical properties of talc. American Mineralogist. 2022;107(1):1–14. http://www.minsocam.org/msa/ammin/toc/2022/open_access/AM107P0001.pdf.
12. Su SC. A rapid and accurate procedure for the determination of refractive indices of regulated asbestos minerals. American Mineralogist. 2003; 88(11–12):1979–1982.
13. McCrone WC. Asbestos Identification. Chicago, IL: McCrone Research Institute; 1987.
14. Deer W, Howie RA, Zussman J. An Introduction to the Rock-Forming Minerals. 3rd ed. London: Mineralogical Society; 2013.
15. Deer WA, Howie RA, and Zussman J. Rock Forming Minerals: Double-Chain Silicates, Volume 2B. 2nd ed. The Geological Society, London; 1997.
16. Perkins RL, Harvey BW. Test Method—Method for the determination of asbestos in bulk building materials. Washington, DC: Environmental Protection Agency (EPA) Office of Research and Development; 1993. EPA/600/R-93/116. https://semspub.epa.gov/work/HQ/17709 8.pdf.
17. International Organization for Standardization (ISO). Air quality—Bulk materials—Part 2: Quantitative determination of asbestos by gravimetric and microscopical methods. ISO 22262-2:2014.
18. International Centre for Diffraction Data (ICDD). Powder Diffraction File. Newtown Square, PA; 2022 PDF Database Products. https://www.icdd.com/#.
5 APPENDICES
5.1 Appendix 1. X-Ray Diffraction Peak Positions
Table 2. X-Ray Diffraction Peak Positions for Talc and Associated Mineralsa
a Potential interferences are noted (2θ based on copper Kα radiation).
b International Centre for Diffraction Data (18).
c I = peak intensity; I = intensity of the most intense peak.
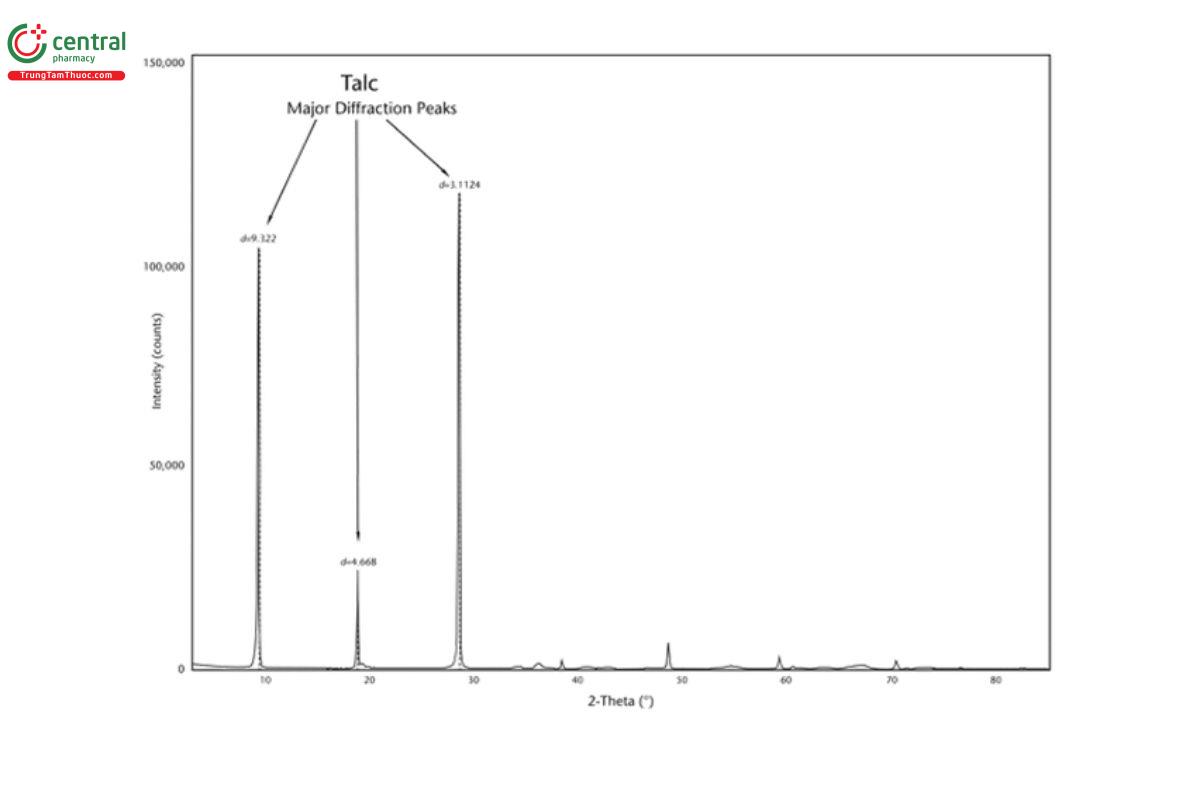
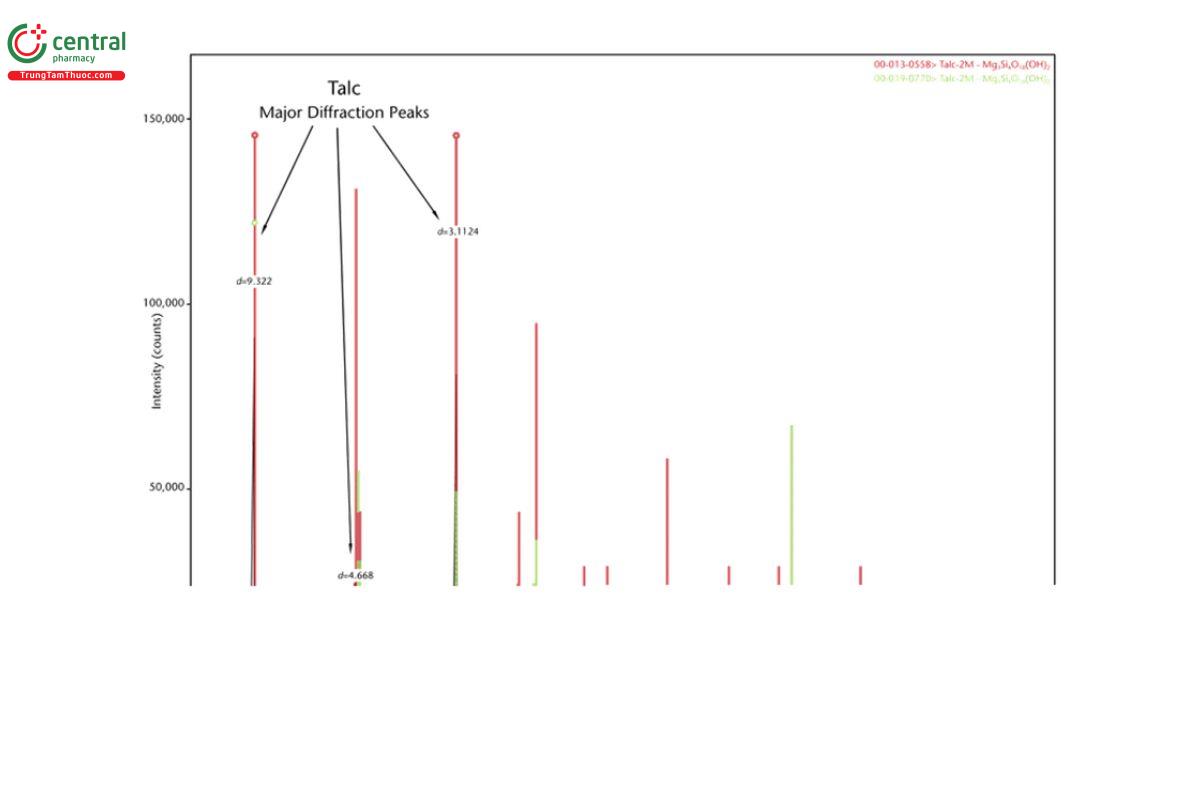
5.2 Appendix 2. Representative XRD Diffractograms
The figures in this appendix show example scans of baseline talc and talc spiked with tremolite, anthophyllite, chrysotile, and chlorite. (Baseline talc has been characterized and found to contain no detectable asbestos or amphibole.) Peak positions in these scans can serve as references for these minerals (also refer to the peak position list in Appendix 1).
5.3 Appendix 3. Representative PLM Images
The following are PLM image examples of chrysotile and amphibole asbestos spiked into talc. Additional images are contained in Appendix 5.


Figure 9. Tremolite (magenta) compared to talc particles (pale blue) in 1.605 RI liquid (magenta particle is oriented perpendicular to the lower polarizer). Spiked material was retained on a 400-mesh sieve.

Figure 11. Tremolite (blue) compared to talc particles (pale blue) in 1.620 RI liquid (blue particle is oriented perpendicular to the lower polarizer). Spiked material was retained on a 400-mesh sieve.
5.4 Appendix 4. Example Materials
[NOTE—Asbestos and nonasbestos standards are becoming difficult to obtain from national laboratories or institutes. The use of in-house or noncertified reference materials may be needed. It is recommended that permanent mounts for PLM be made or purchased to be used for lab reference. Available example materials are listed below.] XRD available certified reference materials
NIST SRM 640b or above silicon powder, d-spacing standard
NIST SRM 674b or above x-ray powder diffraction intensity set
NIST SRM 660a or above LaB6, line position and line shape standard
NIST SRM 675 or above fluorophlogopite, low angle (large d-spacing) standard
Talc available certified reference materials
Brammer primary certified reference material; JCRM R901, R902, R903 (set of three)
Brammer certified reference material, BCS 203a RM asbestos and nonasbestos reference materials
Amphibole
NIST 1867a, uncommon commercial asbestos—tremolite, anthophyllite, actinolite (set of three) Lone Pine tremolite (as provided by Research Triangle Institute)
Anthophyllite and talc (Fisher A-181, Gooch filter)
Serpentine
Whittaker, Clark, and Daniels #1422 asbestos (1971) NIST SRM 1866a commercial asbestos—chrysotile
For XRD, homogeneity concerns must be considered when using dry preparations of reference standards, regardless of preparation size. Therefore, it is recommended that the laboratory analyst use Ethanol, isopropanol, or methanol for all reference standard preparations.
Mortar and pestle preparation can be used for small preparations (<10 g) but should include multiple wet grinding or blending and drying cycles (minimum of three). For large reference standard preparations (>10 g), the laboratory analyst should use ethanol, isopropanol, or methanol in conjunction with milling or grinding using puck or puck and ring mills under shear and impact conditioning or by cylindrical media-mill grinding with impact and planar shearing.
5.5 Appendix 5. PLM Digital Image Library
The following images represent the different minerals immersed in various RI liquids and can be used for reference. Milled chrysotile in talc
Milled chrysotile in talc matrix—1.550 RI liquid (not sieved)
Milled chrysotile in talc matrix (0.1%)—1.550 RI liquid (material retained on 400-mesh sieve) Milled chrysotile in talc matrix (0.01%)—1.550 RI liquid (material retained on 400-mesh sieve)
Milled chrysotile in talc matrix (0.001%)—1.550 RI liquid (material retained on 400-mesh sieve)
Milled tremolite asbestos in talc
Milled tremolite asbestos in talc matrix—1.6 05 RI liquid (not sieved) Milled tremolite asbestos in talc matrix—1.6 15 RI liquid (not sieved)
Milled tremolite asbestos in talc matrix (0.1%)—1.6 20 RI liquid (material retained on 400-mesh sieve) Milled tremolite asbestos in talc matrix (0.01%)—1.6 05 RI liquid (material retained on 400-mesh sieve) Milled tremolite asbestos in talc matrix (0.01%)—1.6 20 RI liquid (material retained on 400-mesh sieve)
Milled tremolite asbestos in talc matrix (0.001%)—1.6 05 RI liquid (material retained on 400-mesh sieve)
Milled tremolite (not tremolite asbestos) in talc
Milled tremolite (not tremolite asbestos) in talc matrix—1.6 05 RI liquid (not sieved) Milled tremolite (not tremolite asbestos) in talc matrix—1.6 15 RI liquid (not sieved)
Milled tremolite (not tremolite asbestos) in talc matrix (0.1%)—1.6 20 RI liquid (material retained on 400-mesh sieve)
Milled talc
Milled talc in 1.550 RI liquid (not sieved)
MILLED CHRYSOTILE IN TALC
Milled chrysotile in talc matrix—1.550 RI liquid (not sieved)
![Figure A1. Milled chrysotile in talc matrix immersed in Cargille n 1.550 HD liquid at 25° oriented so that ɣ′ (and fiber length) is parallel with the direction of the lower polarizer (East–West [E–W]) in central stop dispersion staining.](/images/item/theory-and-practice-of-asbestos-detection-in-pharmaceutical-talc-usp-2025-12.jpg)
Figure A3. Milled chrysotile in talc matrix immersed in Cargille n 1.550 HD liquid at 25° oriented so that ɣ′ (and fiber length) is parallel with the direction of the lower polarizer (E–W) in plane-polarized light slightly defocused to observe the Becke line.
Figure A4. Milled chrysotile in talc matrix immersed in Cargille n 1.550 HD liquid at 25° oriented so that α′ is parallel with the direction of the lower polarizer (E–W) in plane-polarized light slightly defocused to observe the Becke line (fiber length is perpendicular to the lower polarizer).
Figure B6. Milled chrysotile in talc matrix (0.1%). Material retained on a 400-mesh sieve was immersed in Cargille n 1.550 HD liquid at 25° and oriented so that ɣ′ (and fiber length) is 45° clockwise from the direction of the lower polarizer (E–W) and perpendicular with N of the inserted full wave accessory plate in cross-polarized light.
Milled chrysotile in talc matrix (0.01%)—1.550 RI liquid (material retained on 400-mesh sieve)
Figure C1. Milled chrysotile in talc matrix (0.01%). Material retained on a 400-mesh sieve was immersed in Cargille n 1.550 HD liquid at 25° and oriented so that ɣ′ (and fiber length) is parallel with the direction of the lower polarizer (E–W) in central stop dispersion staining.
Figure C2. Milled chrysotile in talc matrix (0.01%). Material retained on a 400-mesh sieve was immersed in Cargille n 1.550 HD liquid at 25° and oriented so that α′ is parallel with the direction of the lower polarizer (E–W) in central stop dispersion staining (fiber length is
perpendicular to the lower polarizer).
Figure C3. Milled chrysotile in talc matrix (0.01%). Material retained on a 400-mesh sieve was immersed in Cargille n 1.550 HD liquid at 25° and oriented so that ɣ′ (and fiber length) is parallel with the direction of the lower polarizer (E–W) in plane-polarized light.
Figure C4. Milled chrysotile in talc matrix (0.01%). Material retained on a 400-mesh sieve was immersed in Cargille nD 1.550 HD liquid at 25° and oriented so that α′ is parallel with the direction of the lower polarizer (E–W) in plane-polarized light (fiber length is perpendicular to the lower polarizer).
Figure I3. Milled tremolite asbestos in talc matrix (0.01%). Material retained on a 400-mesh sieve was immersed in Cargille n 1.620 HD liquid at 25° and oriented so that ɣ′ (and fiber length) is parallel with the direction of the lower polarizer (E–W) in plane-polarized light.
Figure I4. Milled tremolite asbestos in talc matrix (0.01%). Material retained on a 400-mesh sieve was immersed in Cargille nD 1.620 HD liquid at 25° and oriented so that α’ is parallel with the direction of the lower polarizer (E–W) in plane-polarized light (fiber length is perpendicular to the lower polarizer).
Figure I5. Milled tremolite asbestos in talc matrix (0.01%). Material retained on a 400-mesh sieve was immersed in Cargille n 1.620 HD liquid at 25° and oriented so that ɣ′ (and fiber length) is 45° counterclockwise from the direction of the lower polarizer (E–W) and parallel with N of the inserted full wave accessory plate in cross-polarized light.
Figure I6. Milled tremolite asbestos in talc matrix (0.01%). Material retained on a 400-mesh sieve was immersed in Cargille n 1.620 HD liquid at 25° and oriented so that ɣ′ (and fiber length) is 45° clockwise from the direction of the lower polarizer (E–W) and perpendicular with N of the inserted full wave accessory plate in cross-polarized light.
Milled tremolite asbestos in talc matrix (0.001%)—1.605 RI liquid (material retained on 400-mesh sieve)
Figure J1. Milled tremolite asbestos in talc matrix (0.001%). Material retained on a 400-mesh sieve was immersed in Cargille n 1.605 HD liquid at 25° and oriented so that ɣ′ (and fiber length) is parallel with the direction of the lower polarizer (E–W) in central stop dispersion staining.
Figure J2. Milled tremolite asbestos in talc matrix (0.001%). Material retained on a 400-mesh sieve was immersed in Cargille n 1.605 HD liquid at 25° and oriented so that α’ is parallel with the direction of the lower polarizer (E–W) in central stop dispersion staining (fiber length is perpendicular to the lower polarizer).
Figure J3. Milled tremolite asbestos in talc matrix (0.001%). Material retained on a 400-mesh sieve was immersed in Cargille n 1.605 HD liquid at 25° and oriented so that ɣ′ (and fiber length) is 45° counterclockwise from the direction of the lower polarizer (E–W) and parallel with N of the inserted full wave accessory plate in cross-polarized light.
Figure J4. Milled tremolite asbestos in talc matrix (0.001%). Material retained on a 400-mesh sieve was immersed in Cargille n 1.605 HD liquid at 25° and oriented so that ɣ′ (and fiber length) is 45° clockwise from the direction of the lower polarizer (E–W) and perpendicular with N of the inserted full wave accessory plate in cross-polarized light.
MILLED TREMOLITE (NOT TREMOLITE ASBESTOS) IN TALC
Milled tremolite (not tremolite asbestos) in talc matrix—1.605 RI liquid (not sieved)
Figure K1. Milled tremolite (not tremolite asbestos) in talc matrix immersed in Cargille n 1.605 HD liquid at 25° oriented so that ɣ′ (and particle elongation) is parallel with the direction of the lower polarizer (E–W) in central stop dispersion staining.
Figure K2. Milled tremolite (not tremolite asbestos) in talc matrix immersed in Cargille n 1.605 HD liquid at 25° oriented so that α’ is parallel with the direction of the lower polarizer (E–W) in central stop dispersion staining (particle elongation is perpendicular to the lower polarizer).
Figure K3. Milled tremolite (not tremolite asbestos) in talc matrix immersed in Cargille n 1.605 HD liquid at 25° oriented so that ɣ′ (and particle elongation) is parallel with the direction of the lower polarizer (E–W) in plane-polarized light slightly defocused to observe the Becke line.
Figure K4. Milled tremolite (not tremolite asbestos) in talc matrix immersed in Cargille n 1.605 HD liquid at 25° oriented so that α’ is parallel with the direction of the lower polarizer (E–W) in plane-polarized light slightly defocused to observe the Becke line (particle elongation is perpendicular to the lower polarizer).
Figure K5. Milled tremolite (not tremolite asbestos) in talc matrix immersed in Cargille nD 1.605 HD liquid at 25° oriented so that ɣ′ (and particle elongation) is 45° counterclockwise from the lower polarizer (E–W) and parallel with N of the inserted full wave accessory plate in cross-polarized light.
Figure K6. Milled tremolite (not tremolite asbestos) in talc matrix immersed in Cargille n 1.605 HD liquid at 25° oriented so that ɣ′ (and particle elongation) is 45° from the direction of the lower polarizer (E–W) and parallel with N of the inserted full wave accessory plate in cross-polarized light.
Figure K7. Milled tremolite (not tremolite asbestos) in talc matrix immersed in Cargille n 1.605 HD liquid at 25° oriented so that ɣ′ (and particle elongation) is parallel with the direction of the lower polarizer (E–W) in cross-polarized light. The tremolite is at or near extinction.
Figure K8. Milled tremolite (not tremolite asbestos) in talc matrix immersed in Cargille n 1.605 HD liquid at 25° oriented so that ɣ′ (and particle elongation) is parallel with the direction of the lower polarizer (E–W) with the full wave accessory plate inserted in cross-polarized light. The tremolite is at or near extinction.
Milled tremolite (not tremolite asbestos) in talc matrix—1.615 RI liquid (not sieved)
Figure L1. Milled tremolite (not tremolite asbestos) in talc matrix immersed in Cargille n 1.615 HD liquid at 25° oriented so that ɣ′ (and particle elongation) is parallel with the direction of the lower polarizer (E–W) in central stop dispersion staining.
Figure L2. Milled tremolite (not tremolite asbestos) in talc matrix immersed in Cargille n 1.615 HD liquid at 25° oriented so that α’ is parallel with the direction of the lower polarizer (E–W) in central stop dispersion staining (particle elongation is perpendicular to the lower polarizer).
Figure L3. Milled tremolite (not tremolite asbestos) in talc matrix immersed in Cargille n 1.615 HD liquid at 25° oriented so that ɣ′ (and particle elongation) is parallel with the direction of the lower polarizer (E–W) in plane-polarized light slightly defocused to observe the Becke line.
Figure L4. Milled tremolite (not tremolite asbestos) in talc matrix immersed in Cargille n 1.615 HD liquid at 25° oriented so that α’ is parallel with the direction of the lower polarizer (E–W) in plane-polarized light slightly defocused to observe the Becke line (particle elongation is perpendicular to the lower polarizer).
Figure L5. Milled tremolite (not tremolite asbestos) in talc matrix immersed in Cargille n 1.615 HD liquid at 25° oriented so that ɣ′ (and particle elongation) is 45° counterclockwise from the lower polarizer (E–W) and parallel with N of the accessory plate in cross-polarized light.
Figure L6. Milled tremolite (not tremolite asbestos) in talc matrix immersed in Cargille n 1.615 HD liquid at 25° oriented so that ɣ′ (and particle elongation) is 45° from the direction of the lower polarizer (E–W) and parallel with N of the inserted full wave accessory plate in cross-polarized light.
Figure L7. Milled tremolite (not tremolite asbestos) in talc matrix immersed in Cargille n 1.615 HD liquid at 25° oriented so that ɣ′ (and particle elongation) is parallel with the direction of the lower polarizer (E–W) in cross-polarized light. The tremolite is at or near extinction.
Figure L8. Milled tremolite (not tremolite asbestos) in talc matrix immersed in Cargille n 1.615 HD liquid at 25° oriented so that ɣ′ (and particle elongation) is parallel with the direction of the lower polarizer (E–W) with the full wave accessory plate inserted in cross-polarized light. The tremolite is at or near extinction.
Milled tremolite (not tremolite asbestos) in talc matrix (0.1%)—1.620 RI liquid (material retained on 400-mesh sieve)
Figure M1. Milled tremolite (not tremolite asbestos) in talc matrix (0.1%). Material retained on a 400-mesh sieve was immersed in Cargille n 1.620 HD liquid at 25° and oriented so that ɣ′ (and fiber length) is parallel with the direction of the lower polarizer (E–W) in central stop dispersion staining.
Figure M2. Milled tremolite (not tremolite asbestos) in talc matrix (0.1%). Material retained on a 400-mesh sieve was immersed in Cargille n 1.620 HD liquid at 25° and oriented so that α’ is parallel with the direction of the lower polarizer (E–W) in central stop dispersion staining (fiber length is perpendicular to the lower polarizer).
Figure M3. Milled tremolite (not tremolite asbestos) in talc matrix (0.1%). Material retained on a 400-mesh sieve was immersed in Cargille n 1.620 HD liquid at 25° and oriented so that ɣ′ (and fiber length) is parallel with the direction of the lower polarizer (E–W) in plane-polarized light slightly defocused to observe the Becke line.
Figure M4. Milled tremolite (not tremolite asbestos) in talc matrix (0.1%). Material retained on a 400-mesh sieve was immersed in Cargille n 1.620 HD liquid at 25° and oriented so that α’ is parallel with the direction of the lower polarizer (E–W) in plane-polarized light slightly defocused to observe the Becke line (fiber length is perpendicular to the lower polarizer).
Figure M5. Milled tremolite (not tremolite asbestos) in talc matrix (0.1%). Material retained on a 400-mesh sieve was immersed in Cargille n 1.620 HD liquid at 25° and oriented so that ɣ′ (and fiber length) is 45° counterclockwise from the direction of the lower polarizer (E–W) and parallel with N of the inserted full wave accessory plate in cross-polarized light.
MILLED TALC
Milled talc in 1.550 RI liquid (not sieved)
Figure N1. Milled talc immersed in Cargille n 1.550 HD liquid at 25° oriented so that the upturned edge of the plate or ɣ′ is parallel with the direction of the lower polarizer (E–W) in central stop dispersion staining.
Figure N2. Milled talc immersed in Cargille n 1.550 HD liquid at 25° oriented so that the upturned edge of the plate or α’ is parallel with the direction of the lower polarizer (E–W) in central stop dispersion staining.
Figure N3. Milled talc matrix immersed in Cargille n 1.550 HD liquid at 25° oriented so that the upturned edge of the plate or ɣ′ is parallel with the direction of the lower polarizer (E–W) in plane-polarized light slightly defocused to observe the Becke line.
Figure N4. Milled talc immersed in Cargille n 1.550 HD liquid at 25° oriented so that the upturned edge of the plate or α’ is parallel with the direction of the lower polarizer (E–W) in plane-polarized light slightly defocused to observe the Becke line.
Figure N5. Milled talc immersed in Cargille n 1.550 HD liquid at 25° oriented so that the upturned edge of the plate or ɣ′ is 45° counterclockwise from the lower polarizer (E–W) in cross-polarized light.
Figure N6. Milled talc immersed in Cargille n 1.550 HD liquid at 25° oriented so that the upturned edge of the plate or ɣ′ is 45° from the direction of the lower polarizer (E–W) and parallel with N of the inserted full wave accessory plate in cross-polarized light.
(USP 1-Dec-2023)
