Shear Cell Methodology for Powder Flow Testing
If you find any inaccurate information, please let us know by providing your feedback here


Tóm tắt nội dung
This article is compiled based on the United States Pharmacopeia (USP) – 2025 Edition
Issued and maintained by the United States Pharmacopeial Convention (USP)
DOWNLOAD PDF HERE
1 INTRODUCTION
A large number of pharmaceutical processes involve powder transfer and feeding, and the ability of powders to flow in a controlled manner during these operations is critical to product quality. For example, drug product attributes such as weight and content uniformity depend on powder flow characteristics. Shear cells are among the most important methods for measuring powder flow properties, and the data from shear cell testing can be used to predict a wide variety of powder flow behaviors during pharmaceutical manufacturing. Shear cells have many advantages over simpler methods of measuring powder flow (see Powder Flow 〈1174〉), but their operation is more complex and the procedures for their use must be carefully controlled to produce accurate and reproducible data. This chapter describes best practices for obtaining reliable and accurate powder flow data using a shear cell.
1.1 Scope
This chapter focuses on the three most popular shear cell types used for measuring powder flow properties:
1. Translational (Jenike type)
2. Annular (Schulze type)
3. Rotational (Peschl type)
These three shear cell types are categorized as direct shear tests in which a region of the powder is sheared under a series of controlled normal stresses. From these data, a wide variety of parameters can be obtained, including the yield locus representing the shear-stress to normal-stress relationship at incipient flow, the angle of internal friction, the unconfined yield strength, powder cohesion, and a variety of related parameters such as the flow function. In addition, these three shear cells can be set up with wall coupons (see Appendix) to measure the powder wall friction. When the shear cell data are combined, they can be used for bin and hopper evaluation and design. Other testing approaches, such as triaxial testers and indirect or hybrid testers (e.g., the Johanson indicizer), are outside the scope of this chapter.
2 THEORY AND PRINCIPLES
The flow behavior of a powder is fundamentally different from the flow of a fluid. First, powder flow properties and shear behaviors are strongly dependent on the consolidation stresses applied to the powder and are minimally dependent on the strain or flow rate (under the assumption of quasi-static conditions such as flow in a bin). Fluid flow, in contrast, is strongly dependent on the strain rate (where viscosity describes the relationship between shear stresses and strain rates) and is minimally dependent on absolute pressure. Second, when shear stresses are applied to powders, they may not immediately fail (i.e., they can avoid flow under a sustained shear stress), whereas Newtonian and viscoelastic fluids do not behave this way and always flow under an applied shear stress. Thus, powders have the potential for arching and rat-holing, depending on the flow pattern (see Appendix).
However, powders can sustain a shear stress without flowing only up to a certain point. The yield locus for a given powder is a function of many variables, including its composition, particle size and shape, moisture content, temperature, time stored at rest, and the state of consolidation. Once a powder is subjected to stresses (whether by gravity or some mechanical means) that reach or exceed the yield locus, the powder flows. Hence, determining the yield locus for a given powder under conditions representative of its manufacturing process is an essential step in evaluating the flow behaviors for that process. In some circumstances, this may involve testing under controlled environmental conditions, as well as holding the powder under load for an extended period before shearing (a “time test”).
Because powder properties are highly dependent upon the degree of consolidation, the preparation of a uniform powder bed (consistent bulk density throughout the powder bed) is the first critical step of shear cell testing. The next stage of testing is the application of a normal stress (σ) and shear stress (τ) to the powder bed to achieve steady-state shear, resulting in a known state of consolidation. The shear stress then is removed, and a reduced normal stress is applied. A shear stress then is applied and is progressively increased until the powder bed yields and begins to flow. This procedure is repeated at several different normal stress conditions to create a “yield locus” plot. To complete a full flow function analysis, the operator must determine several yield loci, which requires that the uncon fined yield strength be determined under several different levels of consolidation.
Although this chapter focuses on the powder (particle–particle) properties, the wall friction (particle–wall) properties and bulk density are also important. Such properties are used for bin design and also are essential when one compares different wall materials (e.g., different grades and finishes of stainless steel, or the effect of plastic coatings on powder flow behaviors). The most fundamental property of a wall material in this regard is Φ′, the angle of friction between the bulk powder and the wall material, or, correspondingly, the coefficient of wall friction (μ ):
μw = tan(Φ′) = τw /σw
τw = wall shear stress
σw = wall normal stress
Note that Φ′, and hence μw , often are a function of the applied normal stress (σw).
3 DESCRIPTION OF SHEAR CELL COMPONENTS AND DESIGNS
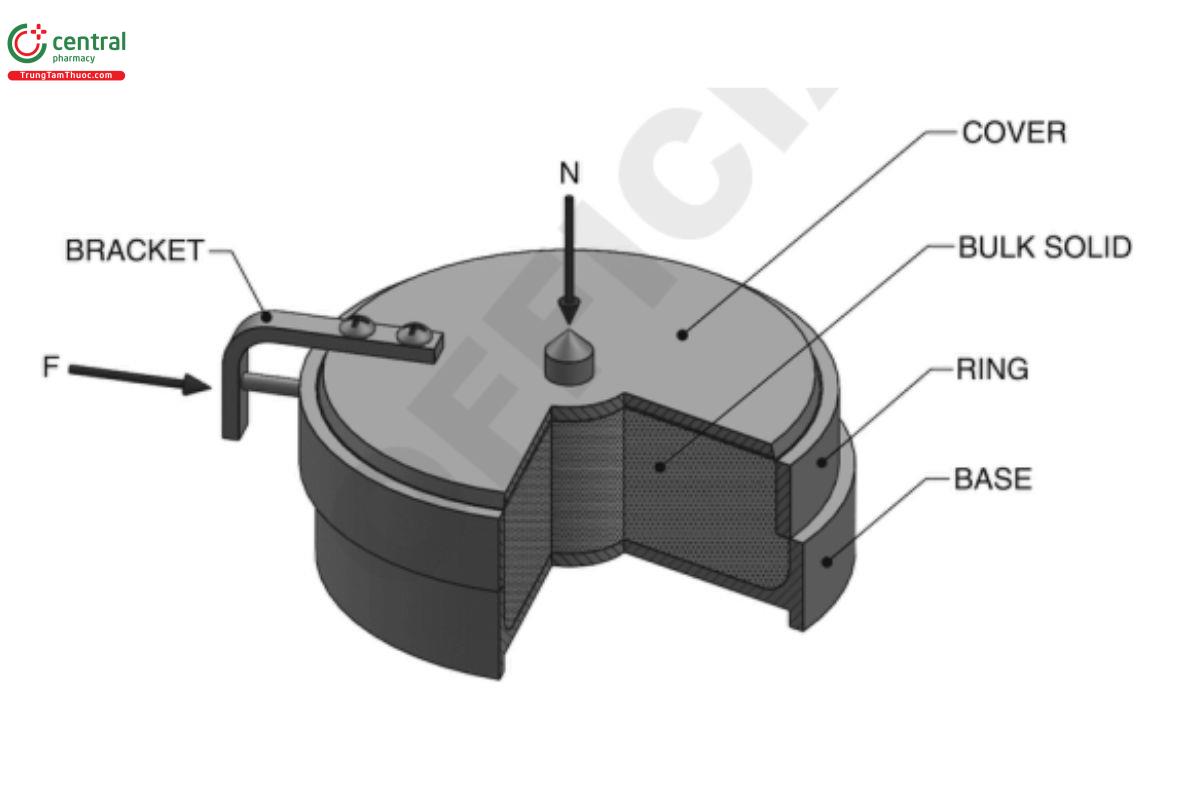
Figures 1, 2, and 3 provide schematics of the different types of shear cells considered in this general chapter. All have the same general operating principle of being able to measure the force required to shear a powder bed to which a normal load has been applied. The appliedload or measured force can be expressed as a stress by dividing by the cross-sectional area of the shear plane under consideration.
The translational shear cell (Figure 1) has a fixed base with a movable ring above it, and both hold the bulk powder. A cover that fits within the ring is used to contain the powder and to provide a uniform application of the normal load (N). The ring and cover are pushed as a unit while a load cell records the shear forces (F) that are generated. The shear plane forms between the powder that is contained in the base and the powder contained in the ring.
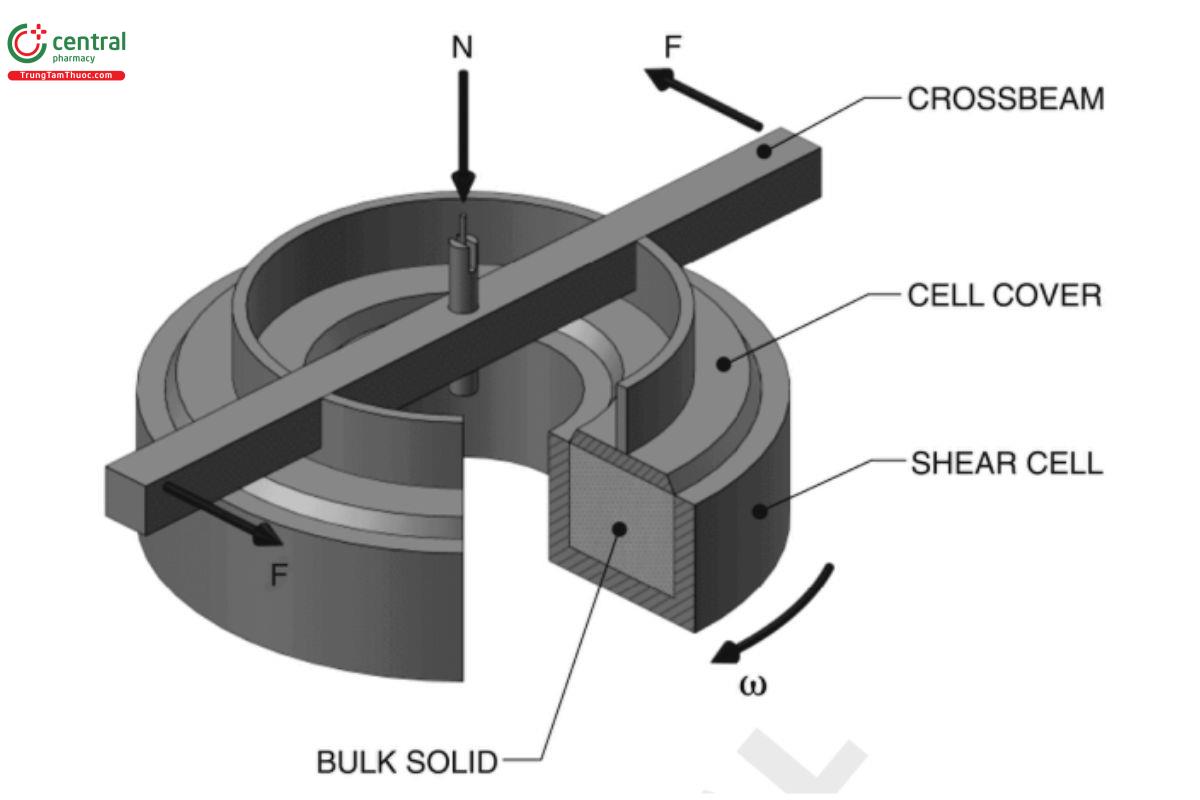
The annular shear cell (Figure 2) consists of a shear cell or base that holds the powder. A cover that fits within the cell is used to contain the powder and to provide a uniform application of the normal load (N). The cover is free to move up and down, but otherwise remains fixed in place by a load cell that measures the shear forces (F) that are generated. The shear cell is rotated at a constant angular velocity (ω) to create a shear plane that forms in the powder bed somewhere between the cell bottom and the cover. The cover and shear cell usually have bafies or other surface features that prevent the powder from sliding or shearing at the interface between the powder and the cover or shear cell base.
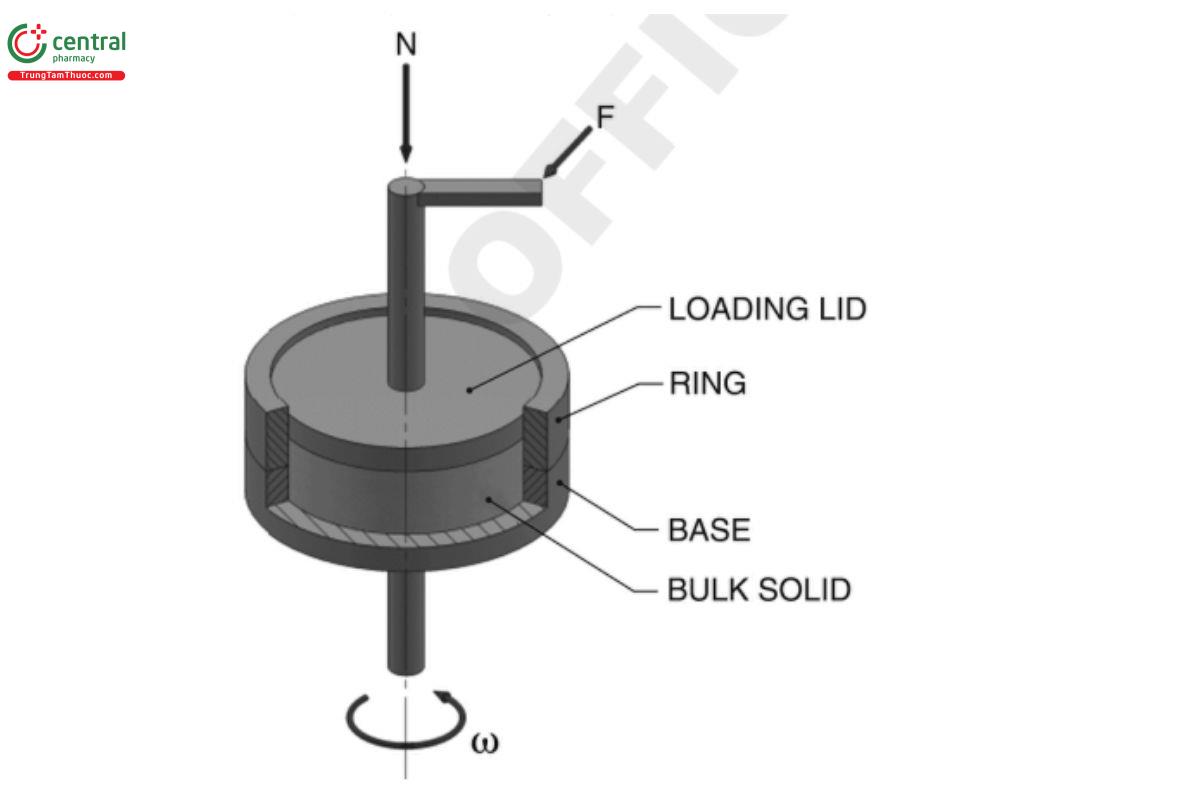
The rotational shear cell (Figure 3) has a base and ring that hold the powder. A loading lid that fits within the ring is used to contain the material and to provide a uniform application of the normal load (N). The loading lid is free to move up and down, but otherwise remains fixed in place, connected to a load cell that measures the shear forces (F) that are generated. The shear cell base then is rotated at a constant angular velocity (ω) to create a shear plane that forms in the powder bed somewhere between the ring and the base. Alternatively, the base can be fixed, and the lid can be rotated to create the shear plane in the powder specimen. The ring and base usually have surface features that prevent the powder from sliding at the powder-surface interface.
The choice of one shear cell type over another depends on factors such as the availability of equipment and ease of use for a particular technician. Because of the in finite travel permitted with the annular and rotational shear cell geometry, these types of cells are more suited for powders for which reaching steady state requires large strains. Another advantage of the in finite travel of rotational testers is that a preconsolidation step may not always be required.
Wall friction tests can be carried out using all of the shear cells referenced in this chapter with only minor modifications, namely by creating a shear plane in which the powder slides over a suitable wall coupon rather than having the shear plane within the powder bed. This usually is achieved by replacing the base of the shear cell with a coupon of the wall material and adjusting the amount of powder used to create a shear plane at the powder–coupon interface.
4 SHEAR CELL MEASUREMENTS
4.1 Sample Preparation
The applicability of shear cell data depends strongly on the use of a representative powder sample. Detailed discussion of appropriate sampling procedures can be found in Bulk Powder Sampling Procedures 〈1097〉.
The cell size (volume and diameter) usually is selected based on the maximum particle size of the powder sample, and the proportion of large particles in the sample. The particle size limit is usually reported by the supplier of commercially available testing equipment. For a translational cell, the maximum particle size is approximately 5% of the diameter of the cell, and for an annular cell the maximum particle size is approximately 10% of the width of the annulus (i.e., the difference between the outer and inner radius of the shear cell trough). Fresh powder is desired for each test, if possible, so the use of a smaller cell may be preferable to reusing the powder. Under some circumstances, a smaller cell may be needed to reach higher consolidation stresses. Smaller cell sizes may have reduced precision and increased bias, depending on the specific tester and the cell size under consideration, because of the larger contribution of non-idealities caused by wall effects.
The shear strength of some powders (e.g., brous or flaky solids) is often caused by interlocking of particles; therefore, such materials may prove to be unsuitable for testing with a conventional shear cell. Likewise, powders with high springback (rubber-like or highly elastic properties) sometimes can fall outside of the practical limits of a shear tester. Poor reproducibility and unexpected results may indicate a problem with testing these types of powders.
Powder samples must be handled and tested under conditions that are relevant from a practical standpoint. For example, many pharmaceutical powders will sorb/desorb moisture from their surroundings according to the ambient relative humidity and temperature. This sorbed moisture can significantly affect the measured powder flow properties. Controlling the environmental conditions during sample handling and testing so that sample behavior is representative of the processing conditions of interest is essential for most powders.
Some pharmaceutical powders “age” quickly after they are produced, and such powders may need to be tested immediately after they are manufactured. The testing of some powders may result in caking or particle attrition that can render a powder unsuitable for retesting. In these circumstances, fresh powder samples should be used for each test.
4.2 Instrument Preparation
The shear cell should be situated in an area that is free of vibrations. Vibrations can affect the instrument readings and also can densify or dilate the powder while it is being tested.
Because shear testers measure forces, their load cells must be calibrated for the forces being measured. Some testers also measure the displacement (linear or angular) of the cell (indicating travel) and/or the vertical displacement of the cover or lid (used to calculate the volume of the cell and hence an average bulk density). In these cases, the displacement transducers must also be calibrated. The rate of any changes in force and displacement will need to be confirmed as part of this calibration. In addition, the shear cell is operated under the assumption that all of the parts are precisely aligned and there is a minimal degree of wobble when the cell rotates. For example, if the cover and shear cell trough are not parallel during testing, it will be difficult to get reproducible results. Thus, the alignment and mechanical operation of the shear cell must be evaluated at regular intervals. No other adjustments with respect to calibration are performed, although the correct performance of the apparatus may be confirmed by the measurement of the yield locus of a reference powder under standardized test conditions.
Wall coupons used for testing must be representative of the surfaces upon which the powder will slide. Directional surfaces can be oriented in the direction of flow in the application (e.g., grain oriented down the length of a hopper), oriented in the worst-case condition (often, grain oriented perpendicular to the direction of flow in the hopper), or evaluated in both directions.
All shear cell components (including wall coupons) should be carefully cleaned before use with a method that does not abrade the surface or leave any chemical residue behind. In addition, the cleaning method should be capable of removing all of the components of the test sample, including lubricants and other additives.
5 SELECTION OF TEST CONDITIONS
Preshear normal stresses usually are selected based on the powder's density values. Standards, such as ASTM Standard 6128, provide tables of specific initial preshear normal stresses as a function of the sample bulk density.1
Subsequent preshear normal stresses are given in multiples of the initial preshear value (e.g., 2, 4, and 8 times the initial level). The number of preshear normal stress levels should be at least 4. It is often valuable to match preshear stresses in the test to the stresses expected in the processing situation of interest. Hold times for time tests are selected based on matching the hold time in the practical application. If long hold times are unrealistic, operators may consider several intermediate time points and extrapolation of the data.
Normal stress levels for shear are selected to provide a range of data points on the yield locus. Typically, a range between 25% and 80% of the preshear normal stress is valid, although powders with high unconfined yield strength or internal friction may require a narrower range.
The range of normal shear stress levels should be sufficient to allow meaningful fitting and extrapolation of the data to determine the unconfined yield stress and other related parameters.
6 TEST PROCEDURE
Shear cell testing involves a sequence of steps that consolidates the powder to a known extent and then shears it under carefully controlled conditions while recording the applied normal stresses and measuring the shear stresses. In most cases, the essential steps are as follows:
1. Fill the test cell with an appropriate and representative sample of the powder in a manner that provides a uniform bulk density and composition. This sample in the test cell is referred to as the “specimen”. Detailed procedures vary according to the type of tester being used, but in all cases it is essential to evenly distribute the powder and avoid pockets of air that can be difficult to remove later.
2. For translational shear cells, perform a preconsolidation step to create the desired density in the cell. This is accomplished by twisting the cover while under a compressive normal load. This step reduces the travel needed to achieve a steady-state preshear value and can limit the total vertical displacement of the cover during the test. A preconsolidation step may be conducted in other cell types, but this is often not conducted, because the unlimited rotation of the annular and rotational cells can generally provide a sufficient state of consolidation. The appropriate level of preconsolidation is critical, and care must be taken not to over- or under-consolidate the specimen.
3. Consolidate the specimen by applying a known normal stress to the powder specimen via the cell cover/lid.
4. Preshear the specimen until a steady-state shear value is reached. Care should be taken to avoid over-consolidating the specimen. The applied shear stress is then reduced to zero.
5. An instantaneous shear test is run by shearing the specimen under a reduced normal stress (with respect to the applied preshear stress) until the shear stress goes through a maximum value and then begins to decrease. Steps 1–5 are repeated at a series of different reduced normal stress conditions to create a complete set of data (yield locus) and then at a series of different preshear normal stress conditions to create a “flow function”. The test cell is preferably emptied and refilled before generating each point on the yield locus. For annular or rotational shear cell types, it is common that steps 3–5 are repeated a number of times for the same specimen without emptying and refilling the cell. If the same specimen is used for multiple test points, caution must be taken to ensure that the specimen has not changed from test to test.
A wall friction test is run in an analogous manner by sliding the specimen over a coupon of wall material and measuring the shear stress as a function of the applied normal stress. In a time test, a normal stress is applied to the specimen for a predetermined period of time before shearing. Both wall-friction and time-consolidation tests can be conducted with the three types of shear cells described in this chapter, as long as directionality (if any) of the wall surface, relative to the cell movement, is taken into account.
7 DATA ANALYSIS AND CALCULATIONS
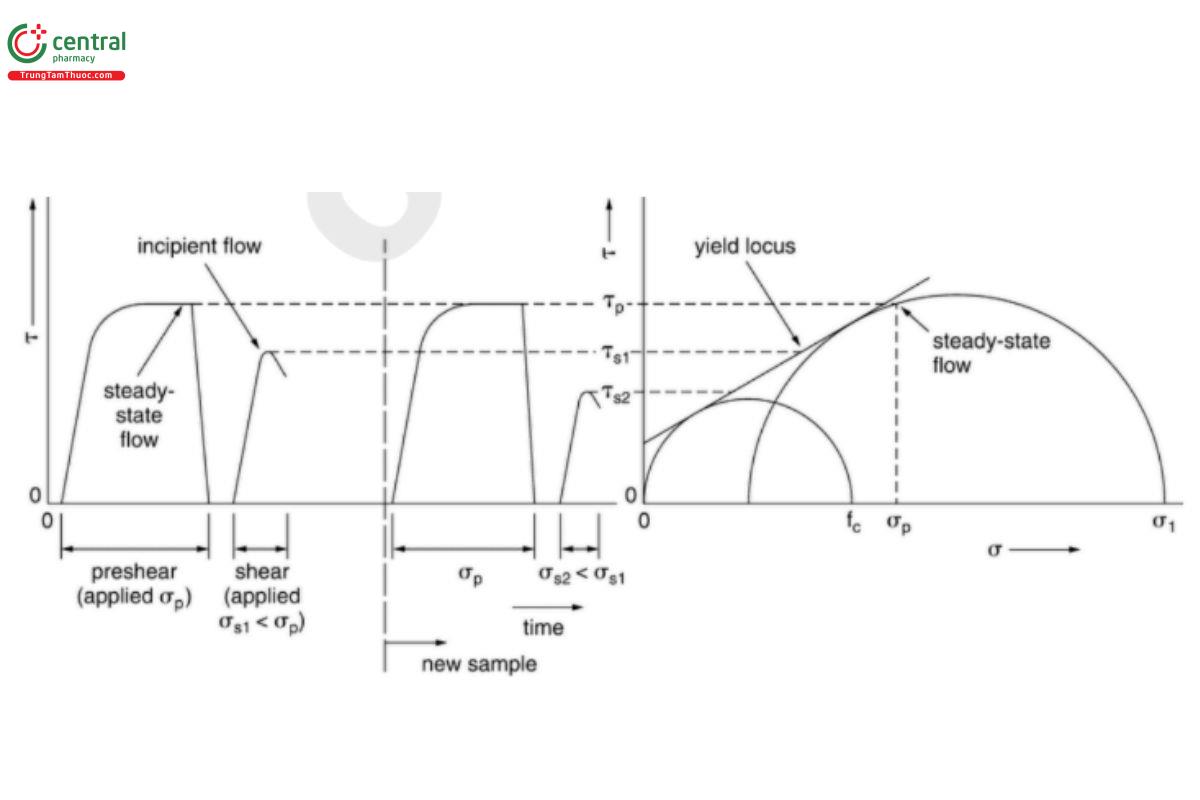
Illustrative results from the shear cell test procedure are presented in Figure 4. For analysis, the applied preshear normal stress (σ ) and all valid applied normal stress points (σsi) for I = 1, 2, 3,..., n and their corresponding measured shear stress points2 (τp, τs1, τs2,..., τsn) are plotted in (σ, τ)-coordinates. These data are then used to generate a smooth line through all the valid shear points to obtain the yield locus. Typically, the yield locus passes above or through the preshear point. If not, the test results should be analyzed in more detail. In some circumstances, the yield locus can be forced to pass through the preshear point and can be fitted to all yield points.
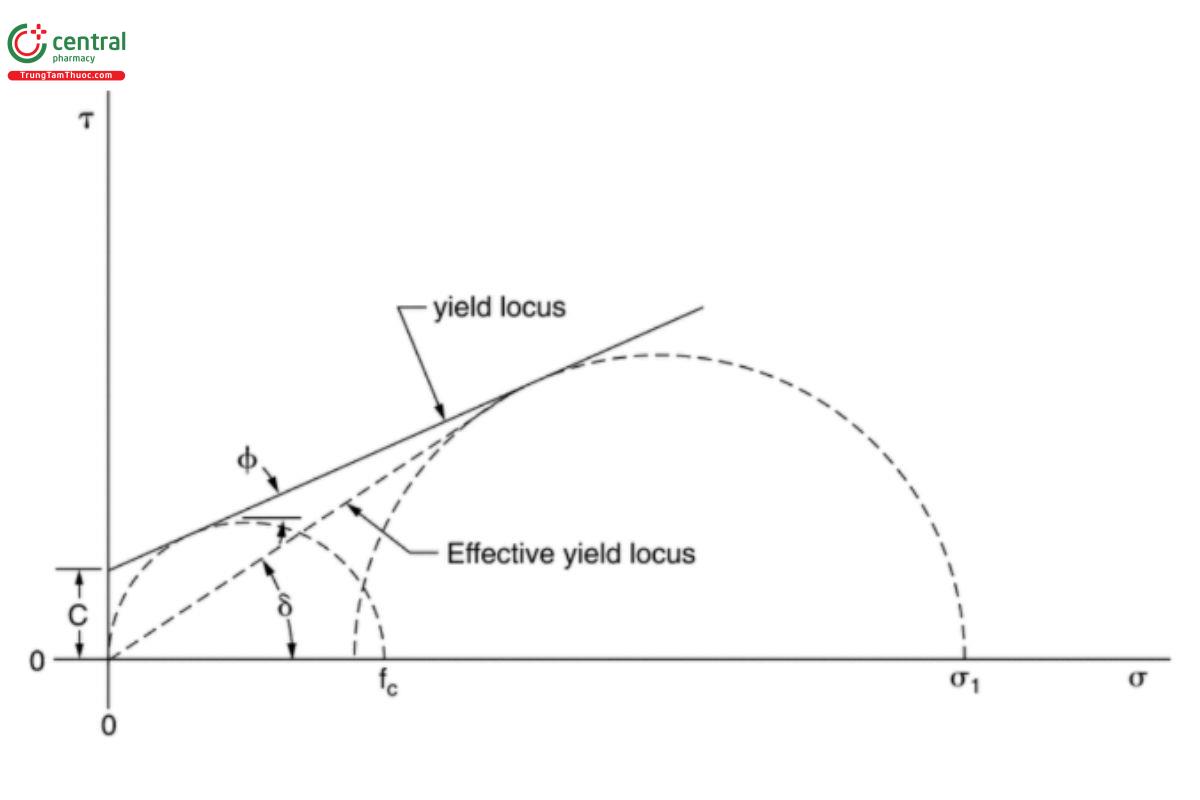
The “unconfined yield strength” of the powder is obtained by drawing a Mohr circle through the origin and tangential to the yield locus. The higher point of intersection of this Mohr circle and the σ-axis is the unconfined yield strength f . The “major consolidation stress”, σ , is found by drawing a second Mohr circle through the preshear point and tangential to the yield locus. The higher point of intersection of this Mohr circle (consolidation locus) and the σ-axis is the major consolidation stress.
The “angle of internal friction”, Φ, is defined as the slope of the yield locus, as shown in Figure 5. A line drawn through the origin and tangential to the steady-state Mohr circle has an angle, δ, that is defined as the “effective angle of friction”. The “cohesion,” C, is the intersection of the yield locus and the τ-axis.
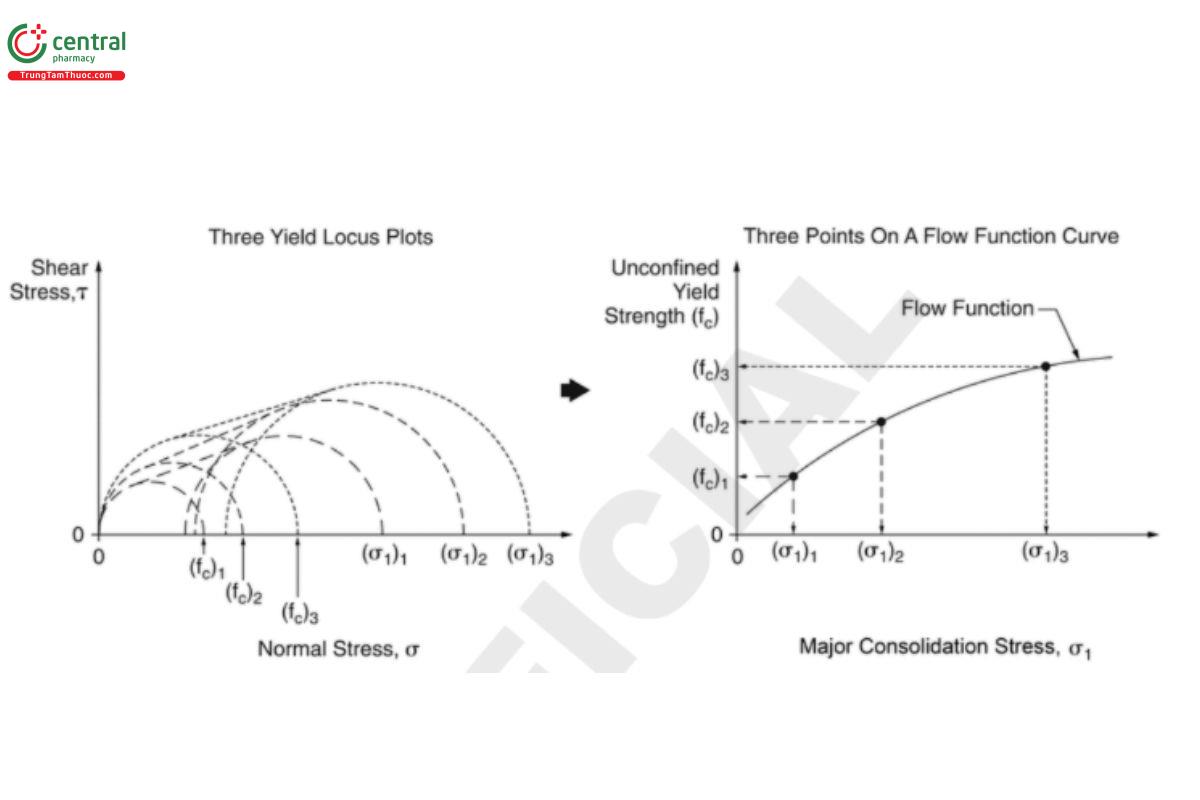
From a family of yield loci generated at different preshear normal stresses, it is possible to plot the unconfined yield strength, f , as a function of the major consolidation stress, σ , as shown in Figure 6. The best-fit curve to these points is called the “flow function” and can be used to calculate the potential for arching and rat-holing in a storage bin.
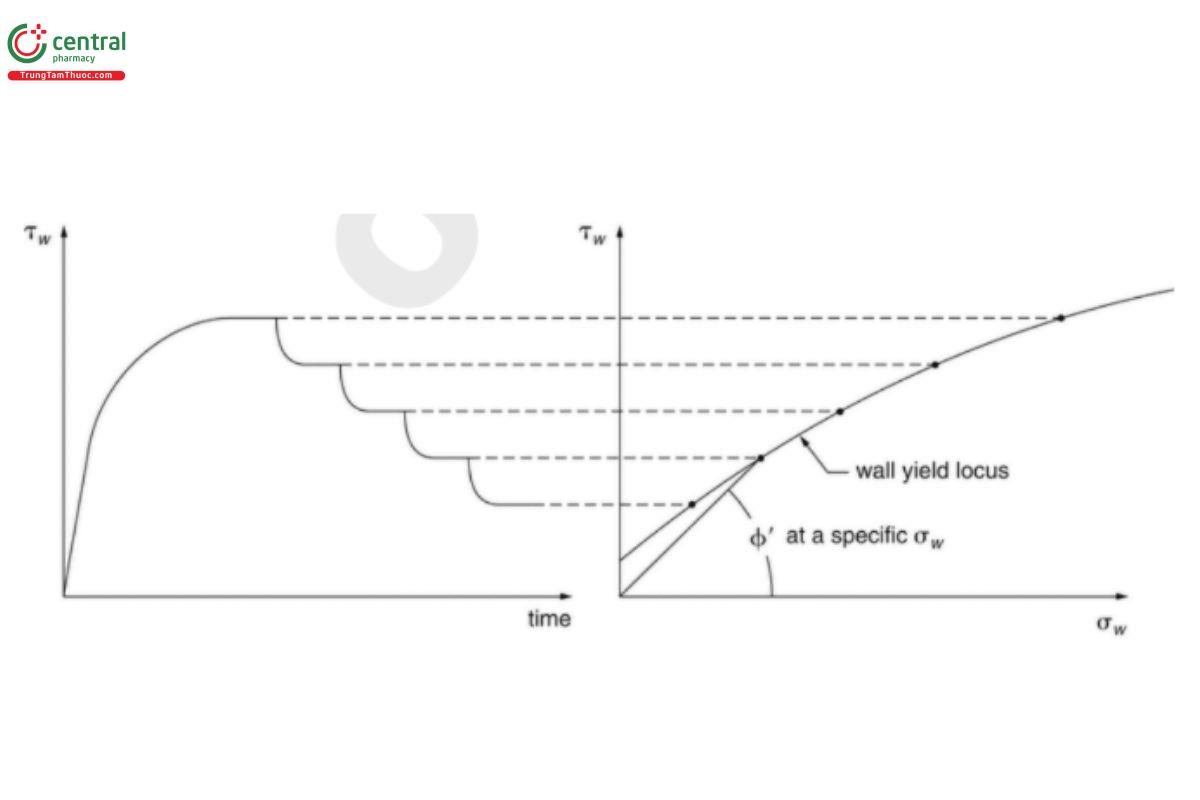
The “kinematic wall yield locus” is developed in a manner similar to the calculation of the yield locus. This is depicted in Figure 7. The “wall friction angle”, Φ′, is defined as the inclination of a line from the origin to a point on the wall yield locus. In general, low wall friction angles are desirable.
Test conditions should be carefully documented for every shear cell analysis to allow for accurate data interpretation and meaningful data comparisons. When analysts compare multiple powders, matching the tester type, specific tester model, test cell size, sample preparation, test procedures, applied normal stresses, and environmental conditions provides increased confidence that any differences in the results are attributable to the powder and not to the test. Changes in material sourcing or manufacturing may require the repetition of the initial studies.
Shear cell tests allow the analyst to characterize consolidated powders under quasi-static conditions. The tests are unable to directly measure powder flow properties at very low stress conditions or high shear rates, which may occur in some powder-handling situations.
Thus, no single parameter can describe powder flowability. Instead, the parameters described in this chapter should be interpreted together and in the context of the conditions under which the powder will be stored and handled (e.g., equipment dimensions, environmental conditions, and others).
The ratio of the major consolidation stress, σ1, to the unconfined yield strength, fc, at a particular value of the major consolidation stress provides a general, simplified way of assessing powder flowability. As a general case, the flow of powdered materials is classified in Table 1.
Table 1. General Classification of Flow Charactera
| σ₁ / fc | Flow Character |
|---|---|
| < 2 | Very cohesive, nonflowing |
| 2 – 4 | Cohesive |
| 4 – 10 | Easy-flowing |
| > 10 | Free-flowing |
a Jenike A. Storage and flow of solids: bulletin no. 123 of the Utah Engineering Experiment Station. Salt Lake City, UT: University of Utah; 1964.
This approach can be useful for rank ordering the flow character of pharmaceutical powders as part of formulation and process development activities. However, it should be noted that this simplified view may lead to significant errors in interpretation because this approach does not take into account the flow pattern or the size or geometry of the manufacturing equipment being used.
8 REFERENCE MATERIALS AND REPRODUCIBILITY
For a tester that is installed and operated correctly, the performance of the instrument and operator can be assessed by testing a standard material. There is currently no specific pharmaceutical reference material for shear cell test method verification. Limestone powder has been used as a certified reference material.3
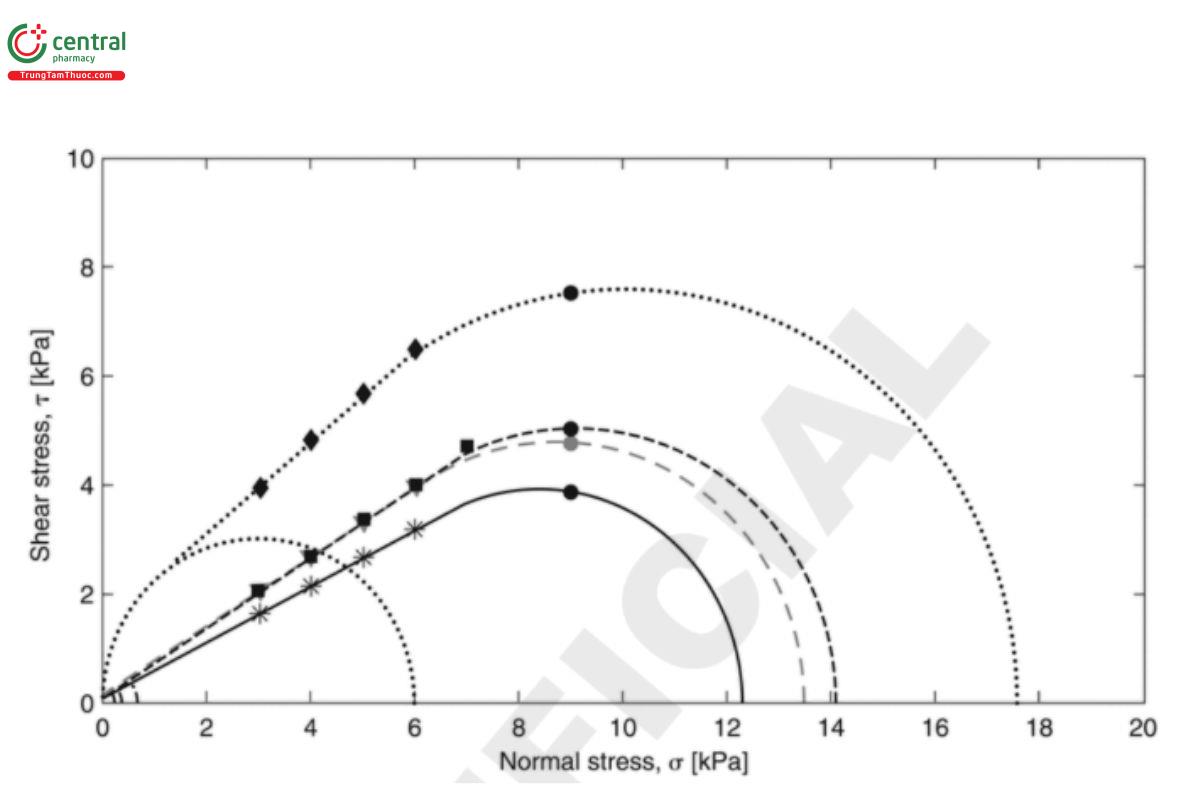
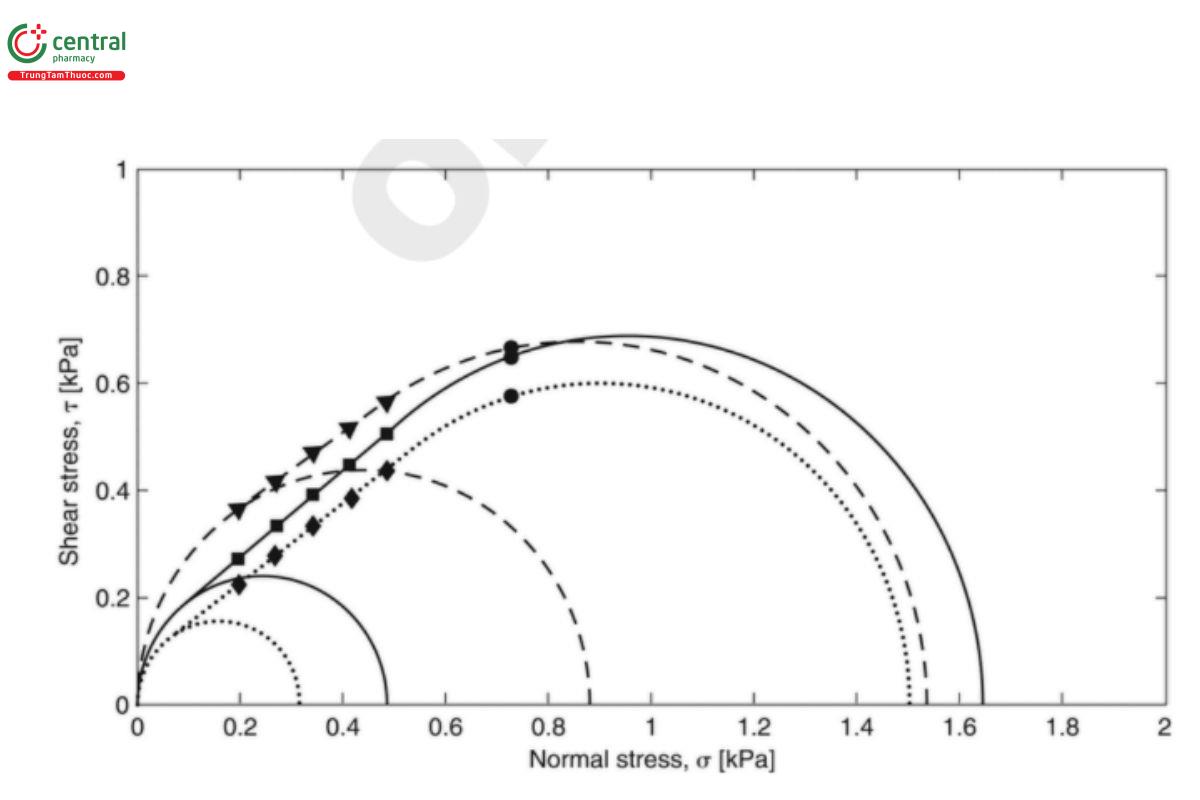
Figures 8, 9, 10, 11, 12, and 13 show representative yield loci and flow function plots for several common pharmaceutical excipient powders determined at a range of conditions. The plots are provided to illustrate the type of data that can be generated for pharmaceutical powders using a shear cell and the typical reproducibility of the data. The data in Figures 8, 9, 10, and 11 were collected using a procedure consistent with that described for Figure 4. These plots are not intended for use as reference data, and they should not be assumed to be representative of all test conditions and material types.
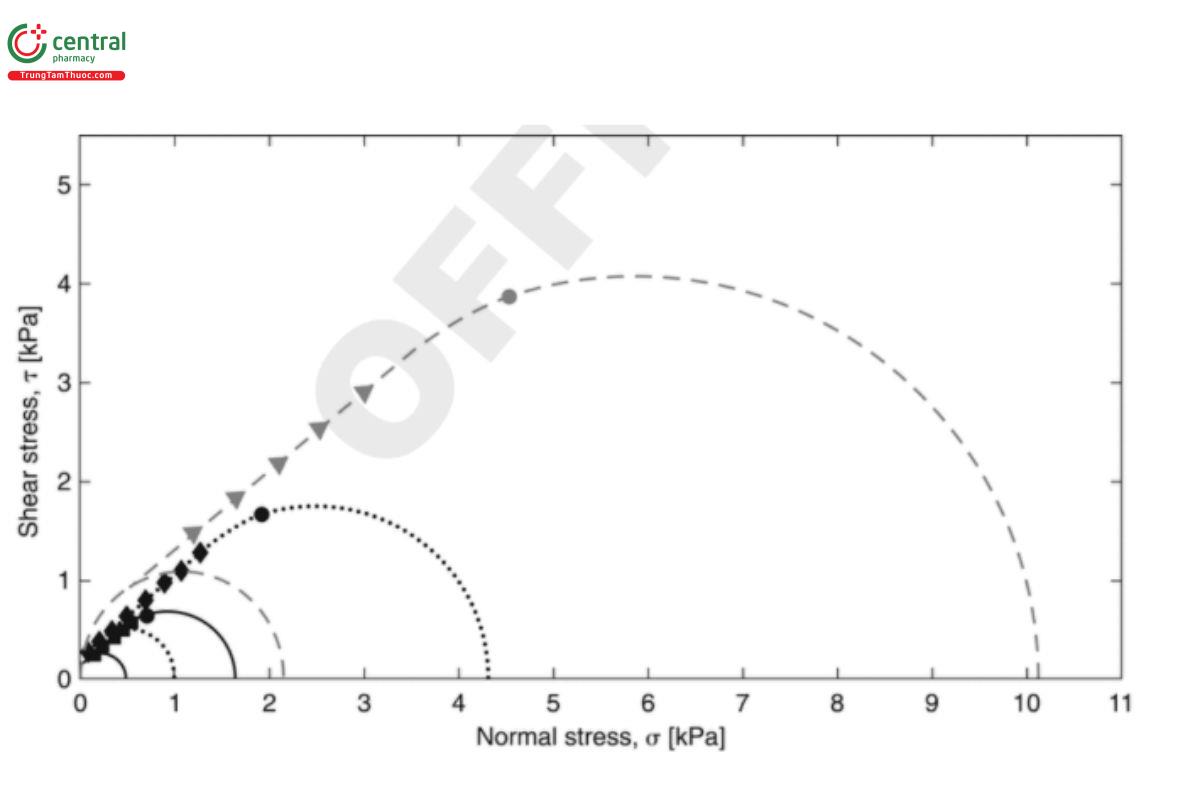
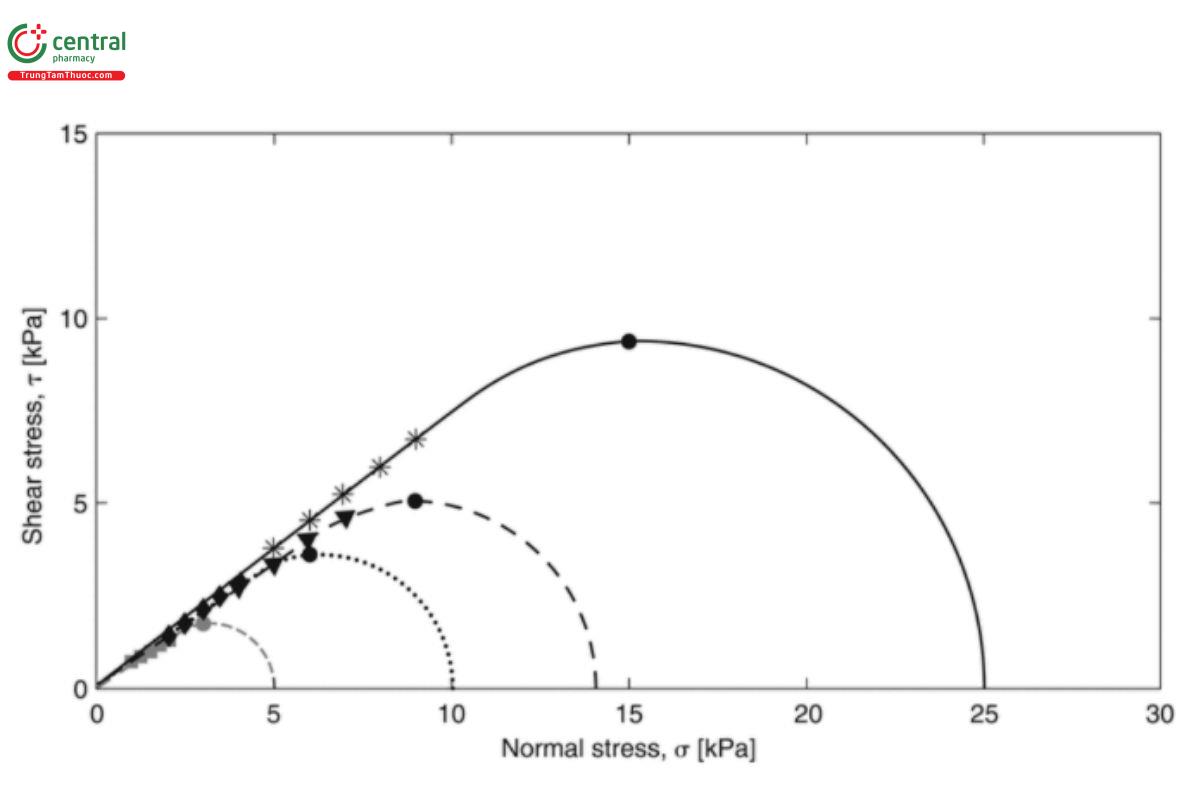
![Figure 12. Representative yield loci for microcrystalline cellulose (Avicel PH102) from three independent determinations conducted at a preshear stress of 9 kPa. [Figure adapted from Sun CC. Setting the bar for powder flow properties in successful high speed tableting. Powder Technol. 2010;201(1):106–108.]](/images/item/figure-12-representative-yield-loci-for-microcrystalline-cellulose.jpg)
Figure 13. Representative flow function plots for microcrystalline cellulose (Avicel PH102) from two independent operators. [Figure adapted from Shi L, Chattoraj S, Sun CC. Reproducibility of flow properties of microcrystalline cellulose—Avicel PH102. Powder Technol.
9 APPENDIX
9.1 Notation
| Term | Symbol and SI Units | Definition | Comments |
|---|---|---|---|
| Angle of internal friction | φ, degrees | The inclination of the yield locus (Figure 5). | |
| Angular velocity | ω, degrees per second | The angular velocity at which the shear cell base rotates. | Is usually held constant. |
| Annular shear cell | N/A | A shear cell based on a rotating annulus design (Figure 2). | The Schulze Ring Shear Tester is a common annular shear cell. |
| Arching | N/A | Formation of a bridge of powder across an opening caused by attractive interactions between particles. | Also known as “bridging”. |
| Bulk density | ρ, kg/m³ | Mass of powder divided by its total volume. | Varies with applied normal stress and sample history. |
| Cohesion | C, Pa | Failure shear stress at zero normal stress obtained by extrapolation of the yield locus (Figure 5). | Indicates intrinsic strength of unconfined powder. |
| Consolidation | N/A | Process of increasing powder density, usually increasing unconfined yield strength via preshear loading. | |
| Coupon | N/A | Flat surface in contact with powder specimen during wall friction testing. | Surface finish must represent the wall surface of interest. |
| Effective angle of friction | δ, degrees | Inclination of the effective yield locus (Figure 5). | Sometimes used as a measure of relative flowability. |
| Effective yield locus | N/A | Line through origin tangent to steady-state Mohr’s circle representing steady flow conditions (Figure 5). | |
| Flowability | N/A | Qualitative estimate of relative flow properties of a powder. | Often based on flow function or effective angle of friction. |
| Flow function | N/A | Plot of unconfined yield strength vs major consolidation stress (Figure 6). | Quantified as ratio of consolidation stress to unconfined yield strength. |
| Lid | N/A | Cover of the shear cell containing the specimen. | Used to measure displacement, bulk density, and dilation. |
| Major consolidation stress | σ₁, Pa | Major principal stress given by steady-state Mohr circle tangent to yield loci. | |
| Mass flow | N/A | Flow pattern where all material moves in a converging hopper. | |
| Mohr’s circle | N/A | Graphical representation of stress state using normal and shear stresses (Figure 4). | |
| Normal stress | σ, Pa | Stress acting perpendicular to the considered plane. | σp is preshear stress; σi are test stresses. |
| Preconsolidation | N/A | Normal stress applied to consolidate powder before testing (Figure 4). | |
| Preshear | N/A | Application of normal stress while shearing to reach steady-state conditions (Figure 4). | |
| Rat-holing | N/A | Powder flows only above an outlet forming a narrow channel. | Also known as “core flow”. |
| Rotational shear cell | N/A | Shear cell operating under rotational shear conditions (Figure 3). | Peschl and Freeman cells are common examples. |
| Shear stress | τ, Pa | Stress required to shear powder perpendicular to normal stress. | |
| Time consolidated strength | fct, Pa | Unconfined yield strength after fixed consolidation time. | |
| Time yield locus | N/A | Yield locus after powder remains at rest under normal stress for a given time. | |
| Translational shear cell | N/A | Shear cell operating under translational shear conditions (Figure 1). | Jenike shear cell is common. |
| Unconfined yield strength | fc, Pa | Major principal stress tangent to yield locus when minor principal stress is zero (Figure 4). | |
| Wall friction angle | φ′, degrees | Arctangent of wall friction coefficient (Figure 7). | |
| Wall friction coefficient | μW | Ratio of wall shear stress to wall normal stress. | |
| Wall yield locus | N/A | Plot of wall shear stress vs wall normal stress (Figure 7). | Used to determine wall friction angle. |
| Yield locus | N/A | Plot of shear stress vs normal stress at failure (Figure 4). | Powder exhibits different loci at different consolidation levels. |
1 ASTM. D6128-06. Standard test method for shear testing of bulk solids using the Jenike shear cell. West Conshohocken, PA: ASTM; 2006.
2 For a given normal stress applied, the measured steady-state shear stress values should be consistent from test to test. To account for normal experimental variations, a given measured shear stress value may be prorated in an appropriate fashion, relative to the steady-state value associated with that point.
3 Limestone powder certified reference material (BCR-116) is available from the Institute for Reference Materials and Measurements of the European Commission and instrument suppliers.
