Presentation of Aerodynamic Particle Size Distribution (APSD) Measurement Data for Orally Inhaled Products
If you find any inaccurate information, please let us know by providing your feedback here

Tóm tắt nội dung
This article is compiled based on the United States Pharmacopeia (USP) – 2025 Edition
Issued and maintained by the United States Pharmacopeial Convention (USP)
1 INTRODUCTION
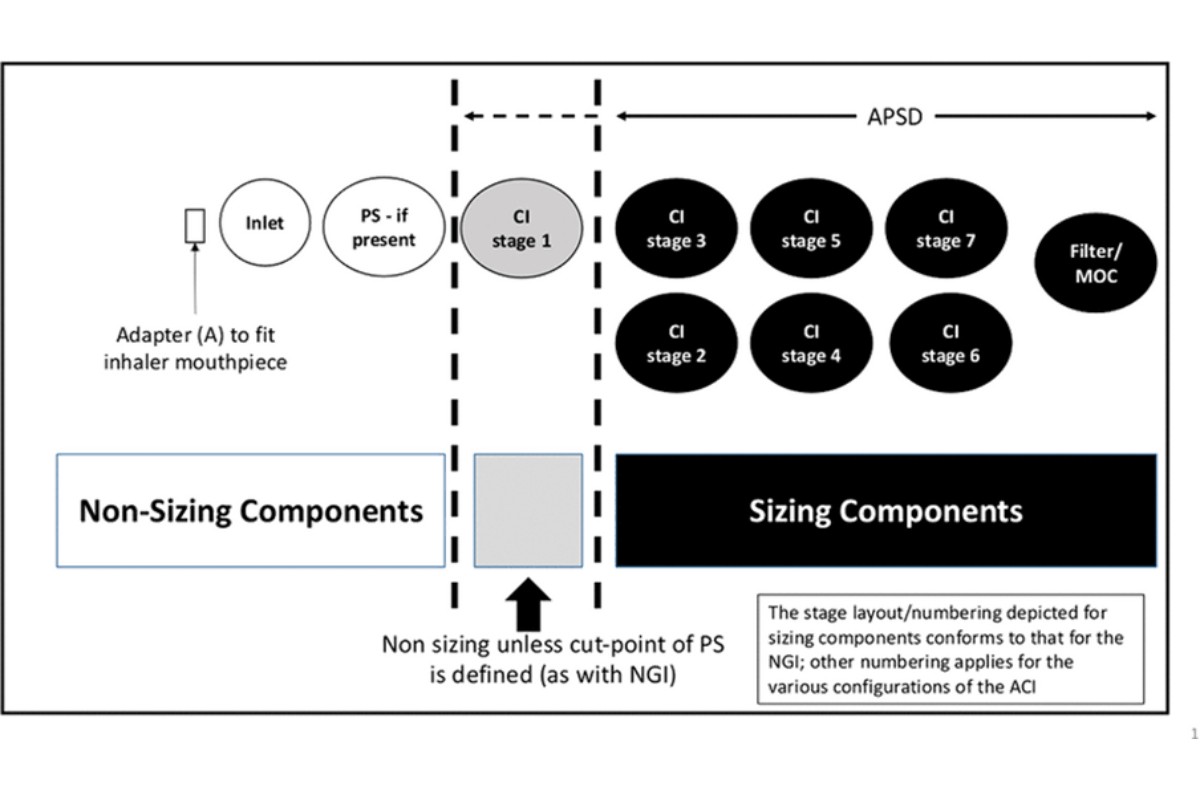
Aerodynamic particle size distribution (APSD) is a critical quality attribute of all orally inhaled drug products (OIP). Characterization of the delivered mass of drug from the inhaler is important to assess product safety and efficacy. This mass includes both (and is the sum of) the sized and non-sized fraction emitted from the patient interface (e.g., the inhaler mouthpiece) (see Figure 1).
The delivered mass excludes drug product deposited on the mouthpiece and is consistent with the target delivered dose as specified in Inhalation and Nasal Drug Products: Aerosols, Sprays, and Powders—Performance Quality Tests 〈601〉.
Although nasal drug products can produce particles whose size can be measured by multistage cascade impactors (CIs), almost all the emitted particulates of a well-designed nasal spray drug product are larger than the normal operating size ranges for CIs (see 〈601〉).
For determination of aerodynamic particle size distribution, the number of actuations should be minimized but sufficient to allow quantification of drug deposited on the stage with lowest deposition without overloading the stage with highest deposition. For details on performing determination of aerodynamic particle size distribution, see 〈601〉.
[NOTE—All figures in this chapter are for illustrative purposes.]
[NOTE—A filter may replace the micro-orifice collector (MOC), which is used with the Next Generation Impactor (NGI), or may be used in addition to the MOC.]
It is not the intention of this chapter to provide guidance on the assessment of comparability of APSDs.
This chapter presents two pharmacopeial approaches that may be used to evaluate CI analysis data, collected as per 〈 601〉 (i.e., at a single flow rate):
Representation of the deposition profile for the entire delivered mass of drug product per actuation, sampled as an aerosol from the inhaler mouthpiece (combination of sized and non-sized particles)
Assessment of the deposition profile of the delivered mass of drug product per actuation from the inhaler mouthpiece by grouping CI stages
Optional uses for APSD data, which are developmental in nature, include:
Representation of the cumulative APSD for the portion of the emitted aerosol sized aerodynamically and determination of associated moments [e.g., mass median aerodynamic diameter (MMAD) and, where appropriate, geometric standard deviation (GSD)] (1)
Assessment of the APSD in terms of pertinent sub-fractions (e.g., when comparing APSD data collected at different flow rates)
The approach used depends on the question being addressed. It might be appropriate to use more than one approach.
1.1 Choice of CI and Sampling Flow Rate for the APSD Measurement
The effective cutoff diameters that define the aerodynamic diameters associated with the sizing components at the CI operational flow rate differ between impactor types [e.g., NGI versus the Andersen Cascade Impactor (ACI)]. The same impactor must be used for stage grouping comparisons; comparison of data for different impactors of the same type can be established through a cumulative distribution curve or sized fractions. Furthermore, comparative measurements should normally be undertaken at the same flow rate unless the intent is to investigate flow rate-dependent changes to the APSD. However, when inhalers with different flow resistances are compared, measurements should be made at the same pressure differential, which will require operating at different flow rates. For some passive inhalation systems [e.g., breath-actuated dry powder inhalers (DPIs)], it is difficult to make meaningful comparisons of aerosol metrics such as fine particle dose (FPD), fine particle fraction (FPF), or MMAD between measurements collected on an NGI versus those collected using an ACI due to the differences in the two impactors' internal volumes. The difference in internal volume alters the initial acceleration and aerosolization of particles emitted from the inhaler early in the profile before the peak flow rate is achieved. Additionally, the NGI and ACI differ because of different stage effective cutoff diameters (ECDs), further prohibiting a direct comparison between the two impactors. [See sections on the ACI or NGI with pre-separator (PS) in 〈601〉, C. Aerodynamic Particle/Droplet Size Distribution—Inhalation Aerosols, Inhalation Sprays, Inhalation Powders, Nasal Aerosols, and Nasal Powders and sections on Apparatus B in 〈 601〉, A. Delivered Dose Uniformity.]
2 APPROACHES FOR PHARMACOPEIAL APSD DATA PRESENTATION
2.1 System Suitability
As part of the CI system suitability verifications during standardized quality control testing, it is required that the mass balance (delivered amount from the inhaler through the impactor as a percentage of the target delivered label claim) for each determination is within 85%– 115% (see 〈 601〉). However, where losses due to internal non-sizing components (also commonly referred to as wall losses) are known to be ≤5% of the total delivered drug mass into the impactor, the procedure may be simplified by assaying only drug on the collection plates. [NOTE—For testing nonstandard flow rates, the method must be validated.]
2.2 Deposition Profile
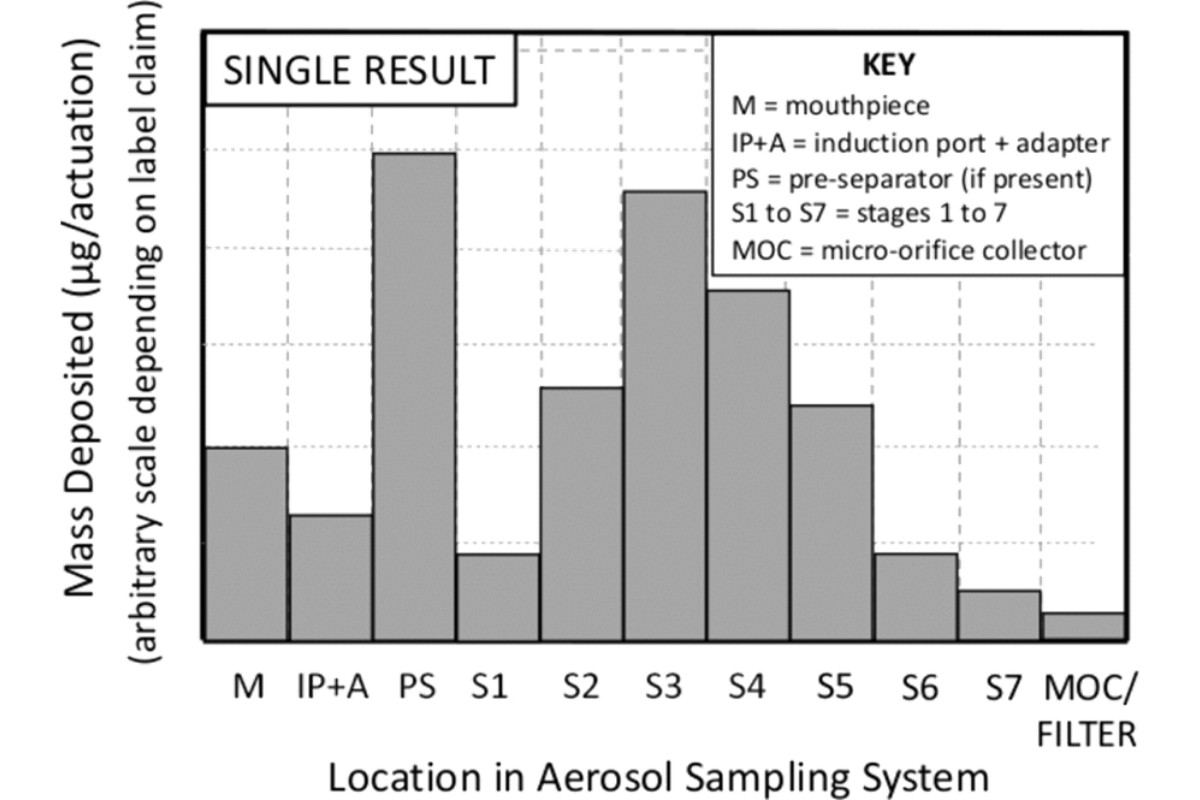
From the analysis of the solutions recovered from the entire apparatus including the patient interface, induction port, pre-separator if used, and all stage collection surfaces of the CI including the back-up filter or MOC (NGI only), calculate the mass of drug substance per actuation deposited on each of the components of the apparatus. Do not include the mass of the drug substance recovered from the interior walls of the CI, as the aerodynamic particle size of such deposits is undefined. The mass of drug substance recovered from the internal walls may, however, be used in calculations to estimate the total mass of drug substance recovered from the apparatus (mass balance; see System Suitability).
Construct a graph with the mass of drug substance per actuation as the ordinate (y) and the collection site within the sampling train as the abscissa (x) (see Figure 2).
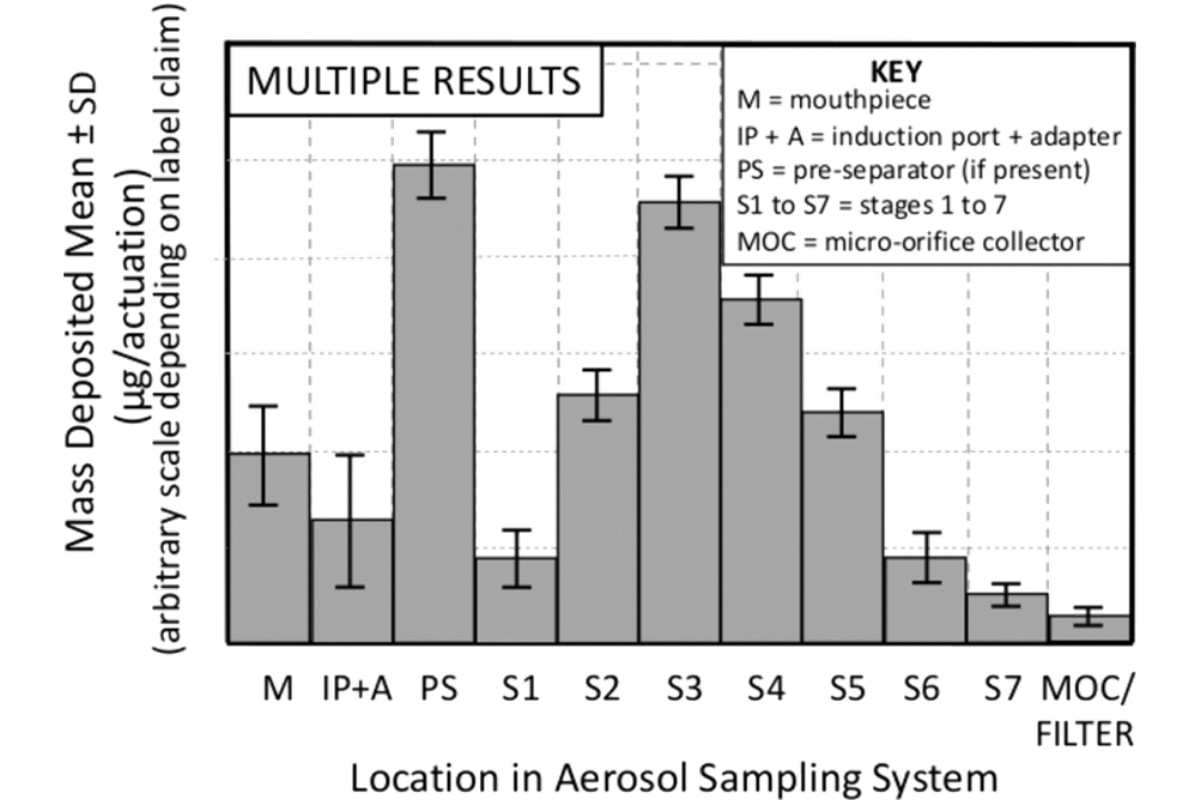
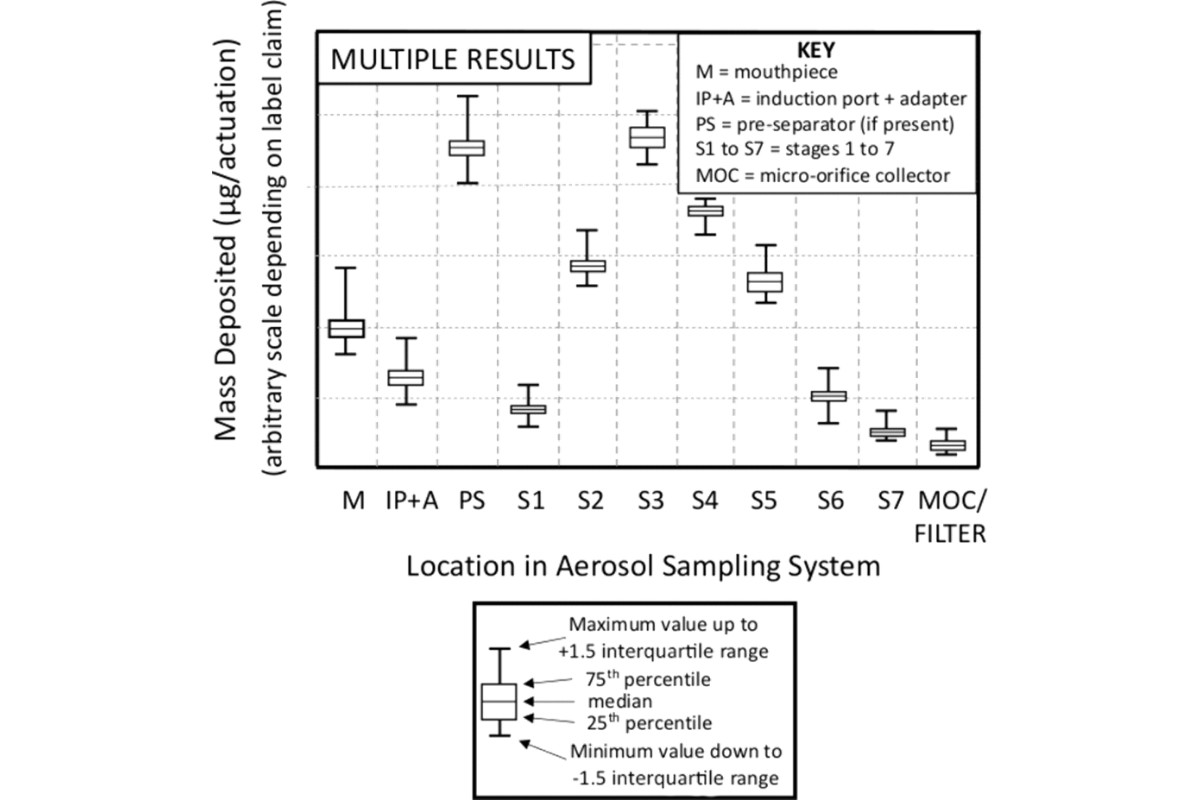
In certain situations, it may be appropriate to compare the mean of several CI determinations. To do so repeat the data analysis procedure for the number of multiple determinations (i.e., X-replicate measurements), by calculating the mean mass of drug substance per actuation for each component together with its standard deviation (SD). Construct a graph with the average mass of drug substance per actuation as the ordinate and the collection site within the sampling apparatus as the abscissa; moreover, error bars may be added, typically representing ±1 SD (see Figure 3). It is also recommended that when presenting data based on multiple determinations that the sample size be noted (i.e., N = X, where X is the number of samples). Additionally, for each component, individual data can be grouped as shown in Figure 4.
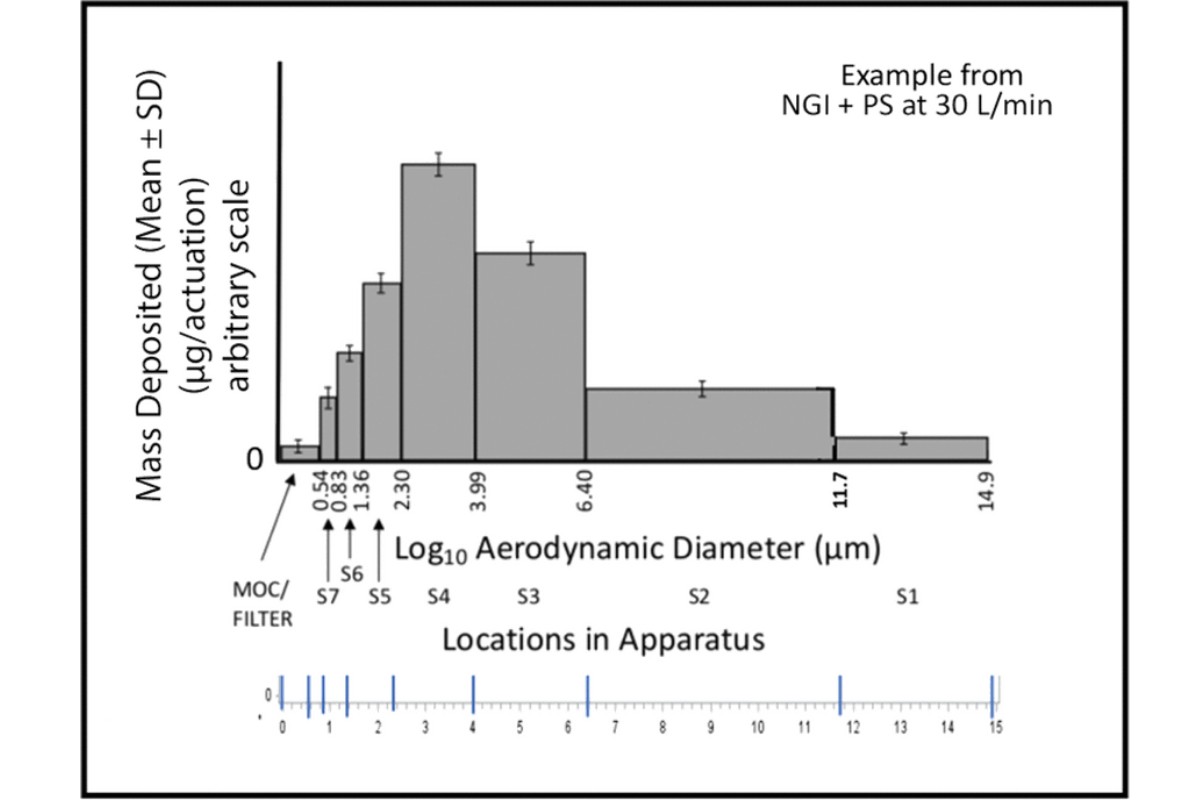
2.3 The APSD: Sized Deposition Profile
The sized deposition profile (SDP) is a representation of the mass of drug substance per actuation versus particle size, expressed in terms of aerodynamic diameter (Figure 5). [NOTE—Some distributions may not conform to the illustration in Figure 5, which is specific to an NGI.] The SD associated with each measurement may also be presented. Only the mass collected on each of the sizing components of the apparatus contributes. Hence, the mass recovered from the initial stage of either the ACI or the NGI when a PS is not present does not contribute to the SDP because there is no maximum size associated with either component. In contrast, when the PS is used with the NGI, mass on the initial stage 1 (S1) does contribute to the SDP because the effective cutoff diameter of the PS is defined through the archival calibration of this apparatus.
Stage Grouping of the Deposition Data
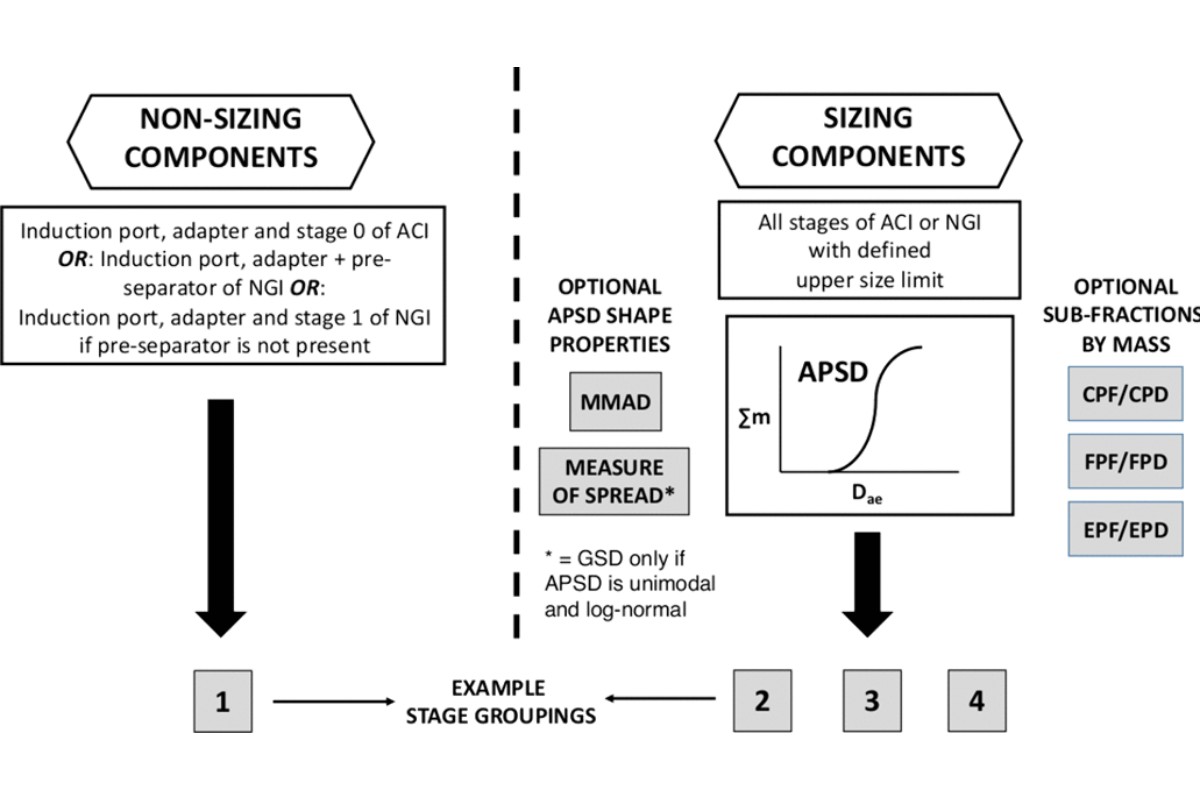
For quality control purposes, the mass deposition data from both non-sizing and sizing components of the sampling apparatus can be consolidated into nonoverlapping groups to summarize the distribution of the mass of drug substance emitted from the inhaler. An illustration of this concept is presented in Figure 6 . Other groupings are possible and the user should therefore seek guidance on this matter from the appropriate regulatory agency. In the illustration provided, the groups have been defined in terms of four relative categories:
Group 1: Mass of drug substance recovered from non-sizing components
Group 2: Mass of drug substance recovered from stages that might be taken as representing the “coarse” particle fraction of the mass Group 3: Mass of drug substance recovered from stages that might be taken as representing the “fine” particle fraction of the mass
Group 4: Mass of drug substance recovered from stages that might be taken as representing the “extra-fine” particle fraction of the mass
The words "coarse", "fine", and "extra-fine" are intended to illustrate sizes only for discussion in this chapter.
Discussion and agreement with the relevant regulatory authority regarding the definition of the boundary sizes of each of the groupings and the related specification setting is strongly encouraged.
3 FURTHER TREATMENTS OF APSD DATA
The APSD: Cumulative Distribution Profile
The cumulative distribution profile (CDP) is a representation of the cumulative mass of the drug substance less than or equal to the stage cutoff diameter versus the stage cutoff diameter.
[NOTE—For comparative purposes, the use of percent CDP alone would be misleading in absence of comparable impactor sized mass (ISM).]
The CDP is commonly expressed as a percentage of the ISM. The sum of the mass collected starting from the first stage, where the upper bound size is defined by virtue of the cutoff diameter of the stage immediately preceding, or of the PS in the case of the NGI, and all stages including the back-up filter or MOC. Starting at the final collection site (filter or MOC), derive a table of cumulative mass versus cutoff diameter of the respective stage. Figure 7 shows how such data can be plotted.
![Figure 7. Curve fitting of cumulative mass-weighted deposition data to generate APSD as a CDP. [CAUTION—Investigation of the APSD in isolation from the non-sized mass fraction of the delivered dose per actuation from the inhaler would likely not provide adequate information on the quality and consistency of a drug product or its batches.]](/images/item/PRESEN%7e1.JPG)
[NOTE—For further guidance, refer to Table 1A, Table 1B, and Table 1C, representing the configurations of the ACI used at 28.3, 60, and 90 L/min, respectively (see 〈601〉); or Table 2A (without PS) and Table 2B (with PS), representing the configuration of the NGI used at flow rate (Q ), which can be any flow rate between 30 and 100 L/min for the evaluation of inhalation aerosols, sprays, and powders, or Table 2C for a flow rate of 15 L/min; or Table 2A (without PS) and Table 2B (with PS), representing the configuration of the NGI used at flow rate (Q ), which can be 15 L/min or any flow rate between 30 and 100 L/min.]
4 GLOSSARY
A: Adapter
ACI: Andersen cascade impactor
APSD: Aerodynamicparticlesize distribution CDP: Cumulative distribution profile
CI: Cascade impactor CPD: Coarse particle dose
CPF: Coarse particle fraction
DPI Dry powder inhaler
ECD: Effective cutoff diameter EPD: Extra-fine particle dose EPF: Extra-fine particle fraction FPD: Fine particle dose
FPF: Fine particle fraction
GSD: Geometric standard deviation IP: Induction port
IQR: Interquartile range ISM: Impactor sized mass M: Mouthpiece
MMAD: Mass median aerodynamic diameter MOC: Micro-orifice collector
NGI: Next Generation Impactor OIP: Orally inhaled product
PS: Pre-separator Q: Test flow rate S: Stage
SD: Standard deviation
SDP: Sized deposition profile X: Sample size
5 REFERENCES
1. Hinds WC. Properties, Behavior and Measurement of Airborne Particles, 2nd Ed. Wiley-Interscience, NY, USA, 1999.
2. Christopher JD, Dey M, Lyapustina S, Mitchell JP, Tougas TP, Oort MV, Strickland H, Wyka B. Generalized Simplified Approaches for Mass Median Aerodynamic Determination. Pharmacopeial Forum 2009;36(3).
