METHODS FOR THE DETERMINATION OF SUBVISIBLE PARTICULATE MATTER
If you find any inaccurate information, please let us know by providing your feedback here

Tóm tắt nội dung
- INTRODUCTION
- SCOPE
- BACKGROUND
- DETECTION AND ENUMERATION OF PARTICLES IN DIFFERENT SIZE RANGES
- APPLICABILITY OF METHODS
- PARTICULATE MATERIAL EVALUATION
- USP SUBVISIBLE PARTICLE LIMITS
- CONTROL OF PARTICULATE MATTER
- SILICONE DROPLETS AND AIR BUBBLES VERSUS NON-SILICONE PARTICLES
- CHALLENGING SAMPLES
- FACTORS AFFECTING ALL METHODS
- TEST ENVIRONMENT AND PREPARATION
- INSTRUMENT STANDARDIZATION TESTS
- CALCULATIONS
- GLOSSARY
- APPENDICES
- REFERENCES
This article is compiled based on the United States Pharmacopeia (USP) – 2025 Edition
Issued and maintained by the United States Pharmacopeial Convention (USP)
1 INTRODUCTION
It is the intent of USP general test chapters Injections and Implanted Drug Products (1) and Particulate Matter in Injections (788) that systems, packaging, and formulation be selected and developed with regard to commercial product cleanliness and stability. Monitoring and limiting particulate levels are an important effort in ensuring product quality and controlling the risk of adverse effects or loss of drug efficacy.
A related chapter, Measurement of Subvisible Particulate Matter in Therapeutic Protein Injections (1787), categorizes particulate matter as intrinsic, extrinsic, or inherent. Process streams, equipment, and other factors related to the manufacturing process may contribute intrinsic particulate matter. Formula components and container/closure systems may contribute to immediate and even long-term generation of intrinsic particles. Poor selection or cleaning of components and systems can exacerbate these problems. The production environment, including personnel gowning and behavior, may contribute extrinsic particulate matter to the filled product. Finally, some products may have a small level of unintended particulate matter that is inherent to the product, even after careful formulation. All of these contributors to particulate matter and final product quality may be evaluated by the methods in (788) or variations thereof.
Historically, the first USP requirements for determination of subvisible particulate matter used the microscopic membrane (MM) method. Membrane filtration has the advantage of collecting a wide size range of particles and retaining these for later analysis, but MM is labor intensive and requires special facilities and operator training. Because it is automated and robust, the light obscuration (LO) method was introduced in USP standards in 1985. By 1995, both methods had been optimized and applied in (788), to both large and small volume products. Appendix 1 contains further information on the historical development of (788).
Several USP chapters are related to subvisible particles, including three compendial chapters, Subvisible Particulate Matter in Therapeutic Protein Injections (787), (788), Subvisible Particulate Matter in Intraocular Solutions (789) (CN 1-May-2024), and the aforementioned informational chapter (1787). This informational chapter is meant to complement the others and focuses on the description of the LO, MM, and flow imaging (FI) methods. All methods should address the specific analytical life-cycle requirements for the individual methodologies (1)
Chapters (788), (a harmonized chapter) and (789), provide an LO test (Method 1) for sizing and counting of subvisible particles (generally 2-100 µm) for nearly transparent, low viscosity ("waterlike") product samples, and an MM particle count test (Method 2) for manual particle sizing and counting as an alternate method. (787), also includes LO and is especially pertinent to protein therapeutics. Fl is recommended as a third method to complement LO and MM, especially for particle characterization, and during product development. Although Fl is not included in (788), FI can provide useful information on the types of particles in a test sample, aiding interpretation of LO and MM results, particularly for protein therapeutics.
In the LO method, a laser beam shines through the liquid sample as it is drawn through an optical flow cell. Any particles, air bubbles, or liquid droplets will scatter or absorb light to some degree, briefly reducing the total transmitted light. Each transient drop in detected light is counted as one particle. The MM method consists of filtering the liquid sample, inspecting the dried filter through a microscope, and manually counting particles above stated size thresholds. Soft objects, such as liquid droplets or aggregated proteins, can pass through or absorb onto the filter and are not reliably counted by this method For the Fl method, the sample is drawn through a flow cell and a sequence of photographic images obtained of particles in the sample. Subsequent automated analysis gives image parameters such as size, morphology, and image intensity, which are useful to categorize particle images and provide improved understanding of the different particle types observed.
Product packaging, formulation, administration, and sourcing have become much more diverse since the 1980s. Improvements in manufacturing and filling arena design and control and the evolving quality of packaging components have steadily reduced the total particle load from adventitious contamination. This particle reduction has come through particle remediation efforts and improvements in product process control. (See Visual Inspection of Injections (1790), 4. Inspection Life-Cycle.)
The complexity of products has expanded to include smaller delivery volumes, specialized dosing and devices, the advent of therapeutic proteins and other biologics, and issues of product and package physical instability. This has led to increased scrutiny of particle load, with an emphasis on particles resulting from formulation-related changes (intrinsic) and product characteristics (inherent), especially for the subvisible particles (defined here as particles between 1 and 100 µm).
Change to read:
2 SCOPE
This chapter is meant to expand upon the information in (787), (788), and Subvisible Particulate Matter in Intraocular Solutions (789), by including Fl techniques and by providing additional guidance on the recommended use of LO and MM.
The use of the Fl method for particle sizing and enumeration in this chapter constitutes a substantial update to past approaches. Fl has become a valuable orthogonal method that provides morphology data. These data contribute to a better understanding of the particle population, help resolve discrepancies between other methods, and provide insight into further definition of the sources of the particle load, supporting risk assessment and evaluation of acceptability. This technique is commonly used for characterization of product and process. Fl is not currently planned for inclusion in (788) because: 1) (788), is a harmonized chapter, and addition of a new technique would require new discussions for acceptance; 2) this is an emerging technique and there is both a lack of historical data from products that have patient exposure and an undetermined relationship of the particle size distribution obtained with Fl relevant to that determined by LO or MM, making the establishment of specifications difficult; and 3) specifications (if/when set in the future) should be set by the stakeholder/company and should be product specific, based on prior knowledge and risk assessment.
This chapter directly supports (788) and (789); however, the chapter is also useful for (787), which addresses particulate matter testing for therapeutic protein products. Therapeutic protein products require special care in terms of particle measurement, and (787) provides modifications to (788) methods that are suitable for protein and other large-molecule formulations. This chapter incorporates those improvements because these are applicable to small molecule formulations as well.
The informational chapter (1787), describes additional tools and instrumentation for analyzing subvisible particles and remains a solid resource for forensic methods. The recommendations in (1787) are applicable to (788) and (789), as well. The techniques included in (1787). are all commercially available and can be used during product and process characterization. However, more experience and development is often necessary before methods can be validated and qualified to the extent necessary for lot release, for use in quality control laboratories, and for application in all product forms.
Tracking and identifying particles allow identification of the sources of the particle load and provide a means to evaluate product acceptability and drive product improvement. USP subvisible particle concentration limits apply to particle sizes ≥10 µm. Note that (788). carries limits for 10-and 25-um particles, and (789), carries limits for 10-, 25-, and 50-µm particles. These limits were based on historical clinical exposure, not necessarily the demonstrated impact on patient safety (2). The use of the LO and Fl methods at smaller diameters can provide valuable insights into product quality, especially in the development of biotherapeutics, as described in (1787). The impetus for evaluation of the <10 µm particle population for protein formulas is addressed by Carpenter et al. (3), Singh et al. (4), and Cao et al. (5-6).
3 BACKGROUND
3.1 Testing Considerations
LO is the preferred first-pass method for (787), (788), and (789), although certain solution formulations may not be easily analyzed using this technique. The LO method may encounter problems with a product that does not have clarity or viscosity approximating that of water. Further, formulation characteristics (e.g., color or viscosity) or inherent formulation properties (e.g., shear-induced changes) may generate erroneous LO data. Similarly, products that produce air or gas bubbles when drawn through the LO sensor, such as bicarbonate-buffered formulations, may generate erroneous high-bias data. LO has an inherent bias for sizing larger or fibrous particles (Feret's diameter ≥50 µm). For fibers that are longer than the illumination zone, LO will report an equivalent circular diameter that is closer to the fiber width than the equivalent circular diameter based on the projected area of the fiber (Z).
The LO method can also be applied to particle sizes considerably smaller than the (788), lower limit of 10 µm with good reproducibility (5) and to particles sizes much larger than the upper limit of 25 µm, with proper sensor selection. Thus, valuable information on the product for visible and subvisible particle content is enhanced by including a few more size categories in the subvisible methods such as ≥2 µm and 25 µm, the compendial thresholds ≥10 µm and ≥25 µm, and perhaps ≥50 µm and ≥100 µm. Chapter (1787), provides guidance and advice for many orthogonal approaches that can also cover expanded size ranges.
Fl is also useful for long-axial-dimension particles, yet it may encounter flow restriction biases. During calibration, size thresholding for LO is determined against spherical calibration standards, thus the results are reported in terms of equivalent circular diameter. MM and Fl utilize direct comparison to linear standards. For particles of low refractive index close to that of the solution (such as protein aggregates), the diameter reported by LO will be smaller than the physical diameter of the particle, especially at sizes ≤5 µm (8). Any particles of entrained air or immiscible liquids (primarily silicone oil) commonly encountered in liquid samples are counted and added to the total particle population. Immiscible liquids and air are not detected by MM and are observed directly as high-contrast images by Fl.
The MM method is useful for testing formulations that are not amenable to LO, such as those with color and viscosity affecting optical detection and those that are emulsions. MM isolates particles as a filter retentate, which a trained and qualified operator then uses to determine the count and size population. The isolate may be used for characterization of the individual particles and forensic microscopic categorization. The filter isolate in the membrane assay can retain particles ranging in size from the nominal pore size to millimeters. The dried, retained solid may differ from its nature in the product liquid. While the operator counts particles on the membrane surface that meet counting criteria (≥10 µm and <25 µm or ≥25 µm), there is also a concurrent, streaming view of particle appearance that provides an impression of the particle types or categories that are present. MM methods will not be useful for evaluation of silicone oil droplets or protein aggregates, because these flexible, amorphous particles are difficult to detect on the membrane and can pass through the pores as well. However, MM often can more accurately measure the size of particles with unusual aspect ratio or physical/optical properties.
The Fl method has the advantage that all particles, liquid droplets, and air bubbles are captured in microscopic images. The images can be classified by morphological and image-intensity parameters, as well as by particle size. The classification can be useful in determining the relative proportions of different particle types, such as silicone oil droplets and protein aggregates. The reliability of the classification must be carefully qualified, especially for sizes <5 µm. Fl has the additional advantage that particles of low refractive-index difference from the matrix formulation are more accurately sized than in LO, although these particles can still be problematic. Selection of proper flow cells and optics configurations in Fi can provide particle detection <10 µm or >50 µm. Chapter (1787), provides more detail on alternate techniques for protein particle characterization. See also ASTM E3060-2016 for additional guidance on Fl methods (9).
With past development of (787), (788), and (789), the focus was always on extraneous or foreign matter present in the finished drug product. Concerns about safety related to capillary occlusion and sterility, as well as pharmaceutical elegance, primarily drove this focus. Safety concerns about large numbers of subvisible extraneous particles were expressed by Langille (2) and Bukofzer et al. (10). However, there is an increased understanding that additional particles may result from the manufacturing process, from product or container degradation, or from properties of the drug product such as self-association. The presence of particles from any of these sources is an important product quality factor. Accurate particle concentration measurements are critical for understanding the content and source of the particulate matter and for ensuring long-term product stability. A more comprehensive explanation of particle categories is provided in 3.2 The Nature of Particulate Matter.
In the case of protein-based pharmaceutics, there is an additional source of particles and associated product safety concerns. Proteins self-associate based on the inherent molecular properties of the specific molecule and can form aggregates in a broad size range, including 1-100 µm and larger. Proteinaceous particles in this size range can be quantified using LO and Fl. Aggregated proteins have the potential to be immunogenic, adding another level of complexity to the monitoring and control of subvisible particles in protein therapeutics. On the other hand, protein-based vaccines may consist of aggregates or organized complexes such as viruslike particles, as inherent components of the vaccine product. In vaccines, immunogenicity is a desirable attribute, and subvisible particle monitoring may be performed to monitor product quality and batch consistency. The strategy and practices described in this chapter provide approaches for the safety and quality evaluation of the drug product. Safety perspectives for proteinaceous subvisible particles were introduced (as counterpoints) by Carpenter et al. (3) and Singh et al. (4) and more recently addressed in commentaries by Corvari et al. (11) and Narhi et al. (12). This has resulted in a substantial body of work exploring the potential immunogenicity of protein particles, which was reviewed by Moussa et al. (13), among others.
3.2 The Nature of Particulate Matter
Particles arise from many different sources. Over time, with growing experience in manufacturing and administration of therapeutics, it has become apparent that not all particles are equivalent in terms of their effects on safety or indications for product stability. One way to capture this difference in the risk associated with particles is to classify them into three broad categories: extrinsic, intrinsic, and inherent (See (1787)). However, within these categories, different particle types can pose different patient safety risks. Since particle counting instruments have limited ability to differentiate among particle types, no single technique may be adequate to delineate the categories and track the particulates of most concern for product quality.
Ophthalmic Products-Quality Tests (771), Injections and Implanted Drug Products (1), (787), and (1787), have all adopted a unified definition for particulate matter. Two categories, extrinsic and intrinsic, describe the traditionally held concept of particles as foreign matter. A third category, inherent, describes particles that represent the character of the drug formulation and typify acceptable product. For further details, refer to (1787). The European Pharmacopoeia and Japanese Pharmacopoeia use two categories, extrinsic, which is from outside the manufacturing process, and intrinsic, which includes anything from the manufacturing process or the active ingredient and formulation components (the latter two described as inherent in the USP).
Heterogeneous particle populations are common (e.g., more than one chemical entity with many variations of density, refractive index, color, and shape). Heterogeneous particles are classified as either extrinsic or intrinsic based on the non-proteinaceous component that presents the greatest risk. Orthogonal techniques must be used to fully understand this particle type. As with all quality attributes, the ultimate decision on what levels are allowed should be tied to risk assessment and the clinical history of the product.
4 DETECTION AND ENUMERATION OF PARTICLES IN DIFFERENT SIZE RANGES
Particle formation often occurs across a size continuum with the lower end of the visible range near the upper region of the detection methods described herein (see Figure 1 and (1790)). The size range detected depends on the particle type and method used, and care should be taken to choose the appropriate method for the population being tested.
The techniques reviewed in this chapter are applicable for the determination of unwanted particle content, such as contamination, solids from instability, and insufficient package cleaning, as well as particles that arise from lubricants, product contact, formulation components, and the active pharmaceutical ingredient (API) itself. These particles vary in size from tens of nanometers to hundreds of micrometers, and many particle types do not have a defined size. Instead, they occur as a broad distribution of sizes, often with many more particles in the smaller size portion of the distribution.
Pharmaceutical products come in various forms with large differences in particle size distributions and in concentrations of particle types. Drug forms may include nanoparticulate suspensions, solid drug suspensions, and emulsions. Extremes of drug concentration and factors such as color and transmission variability, along with a wide array of active ingredient sources that have small to very large molecular weights, may all play a role in particulate formation. Packaging varies in terms of fill volumes and materials, which include soft polymers, glass, and hard polymers. Medical devices, combination devices, and unique drug delivery systems are also on the market. Sampling many of these systems presents a challenge to existing conventional procedures.
For example, products formulated as non-solutions are inherently particulate in nature and can thus complicate the analysis of the unwanted subvisible particles within the overall product. For this reason, it may be necessary to monitor subvisible product at non-adjuvanted/intermediate product stages, where justified. One can also evaluate the particle load of a Placebo or media fill on the same line to demonstrate quality. Whatever their nature, monitoring of subvisible particles is important to ensure consistency from lot to lot and between clinical and commercial products.
Evaluation, test method development, and control for particles in the formulation in the <10-µm range can be important for some of these products. For biologics and vaccines, detection below 10 µm is important to capture protein aggregate contents (see (787), and (1787)). Ophthalmic solutions require particle determination at an additional 50-µm threshold, as specified by (789). Correlation of subvisible content with the visual inspection program (see (1790)) promotes the use of higher-end instruments to probe the lower end of the visible size range. Certainly, there are other applications that may affect the system design and use. Calibration is described in (788) as "....apparatus is calibrated using dispersions of spherical particles of known sizes between 10 and 25 µm. These standard particles are dispersed in particle-free water. When detecting particles <10 µm and those ≥50 µm, as discussed in (789), calibration may be necessary far outside the conventional range set for in (788) in order to address the above considerations.
The sizes reported and the populations interrogated are quite dependent upon the technique, so it may be necessary to run orthogonal techniques plus qualitative particle identification to assess the particle population with confidence. Chapter (1787), provides an overview on the practical use of commercial instrumentation for the pharmaceutical subvisible range (2-100 µm). The difficult <2 µm domain, which is of interest for quantifying inherent protein-particle content of biotherapeutics, will require multiple techniques for full understanding (14). Note that (787), and (1787), focus on the inherent protein (or other formulation) particles, rather than contamination analysis.
No single method should be used during development, but rather orthogonal testing should be employed for full characterization and understanding of the expected particle population for that particular product. During production, if the LO lot release method fails, these methods can be deployed to determine root cause and other factors.
All three methods produce appropriate counts in size thresholds when used properly and applied to appropriate sample formulations and particle populations. But each can be misused, and each has inherent drawbacks to consider. Calibration and operator training are imperative. Instrument standardization and count accuracy demonstrate appropriate configuration. See Table 1.
The comparison in Table 1 considers visible to subvisible techniques recommended for all particle sizes. It underscores that an orthogonal approach for particle evaluation and tabulation is important to obtain comprehensive information about the particle population and thus product fill integrity and product stability. The (788), guidance methods are used as a baseline and as prospective release methodology. The use of additional non-compendial techniques may be necessary to develop a full understanding of the particle population. An example of these techniques has been reviewed in (1787), and in a 2016 Stimuli article (15).
Final product quality regarding particulate matter must include both the visible and subvisible size ranges, which may be related for certain incidents involving contamination or product instability. Inherent particles resulting from protein self-association often span a continuum from sub-micrometer to visible particles as well. Chapter (1790), provides a comprehensive discussion of visible particle detection systems and product development considerations.
5 APPLICABILITY OF METHODS
All sterile solutions for injection or parenteral infusion are included within the scope of these test regimens. However, some solutions are amenable to the methods while others are not. All will require qualification of the methods for specific product forms and formulation families.
Clear, aqueous-solution formulations with low to moderate concentrations of the active pharmaceutical ingredient (API), and simple vehicles, will be the most suitable (with minimal method development or changes) and amenable to all (1787), and (1788) methods. Of greatest concern for all techniques are formulations that have competing solids, suspensions (either as-is or after resuspension), emulsions, and nanodispersions. Many of these issues may be addressed by additional sample treatment. Informational chapter (1790) and PDA Technical Report No. 79: Particulate Matter Control in Difficult to Inspect Parenterals (16) discuss options for analyzing the visible particles in these products, which are also applicable to subvisible assays.
Certain products may exist as suspensions, i.e., containing insoluble components in the formulation. Examples include cellular therapeutics and adjuvanted vaccines. Such products may not be tested directly unless a phase separation of the product is feasible, allowing subsequent analysis. Other techniques described in (1787), may be useful.
Table 1. Comparison of Visual Inspection, LO, MM, and FI
| Technique | USP General Chapter(s) | Sample Volume | Compendial Method-Based Detection Ranges | Method Artifacts | Method Limitations |
| Visual | Visible Particulates in Injections 〈790〉, 〈1790〉 | Container volume in a defined cylinder of view | Probabilistic, nominally single particles >100 µm in reflected light; color, opacity, and refractive index (RI) difference aid detection | Subjective decisions, container seams and irregularities, air bubbles | Particulate matter (PM) of small size, transparency, or low contrast; dwell time and depth of field or container/formula limitations on detection |
| LO | 〈787〉, 〈788〉, 〈789〉, 〈1787〉, 〈1788〉 | 0.2–5 mL per draw of product or test fluid | PM >2 µm up to sensor limit; shadow on the detector from particles in confined cell between illuminator and sensor; upper limit depends on the sensor used; opacity, RI difference aid detection | Air, immiscible liquids, Schlieren effects, cell soiling, high PM concentration | Low contrast and large PM (>500 µm); floaters, sinkers, very thin flakes; size range determined by sensor choice |
| MM | 〈788〉, 〈789〉, 〈1788〉 | 0.1 to hundreds of milliliters per draw of product or test fluid | PM >5 µm; virtual optical image by reflection and shadowing on membrane substrate; particles are retained on the membrane for subsequent analysis, if desired | Membrane features, PM in rinse or glassware, deposition/drying effects on membrane | Air, immiscible liquids, soft or gelatinous semisolids that may sink into surface; sample must be chemically compatible with membrane and visually discernible |
| FI | 〈1788〉 | 0.5–1 mL per draw of product or test fluid | PM generally >2 µm to an upper limit depending on the flow cell; digital camera images captured; image and dimension may be evaluated post-collection | Particles adhering to cell walls, transient air gaps; cell contamination effectively removed by background subtraction; changes in cell contamination are a bigger issue | Low-contrast PM, floaters, fibers; size range determined by flow cell |
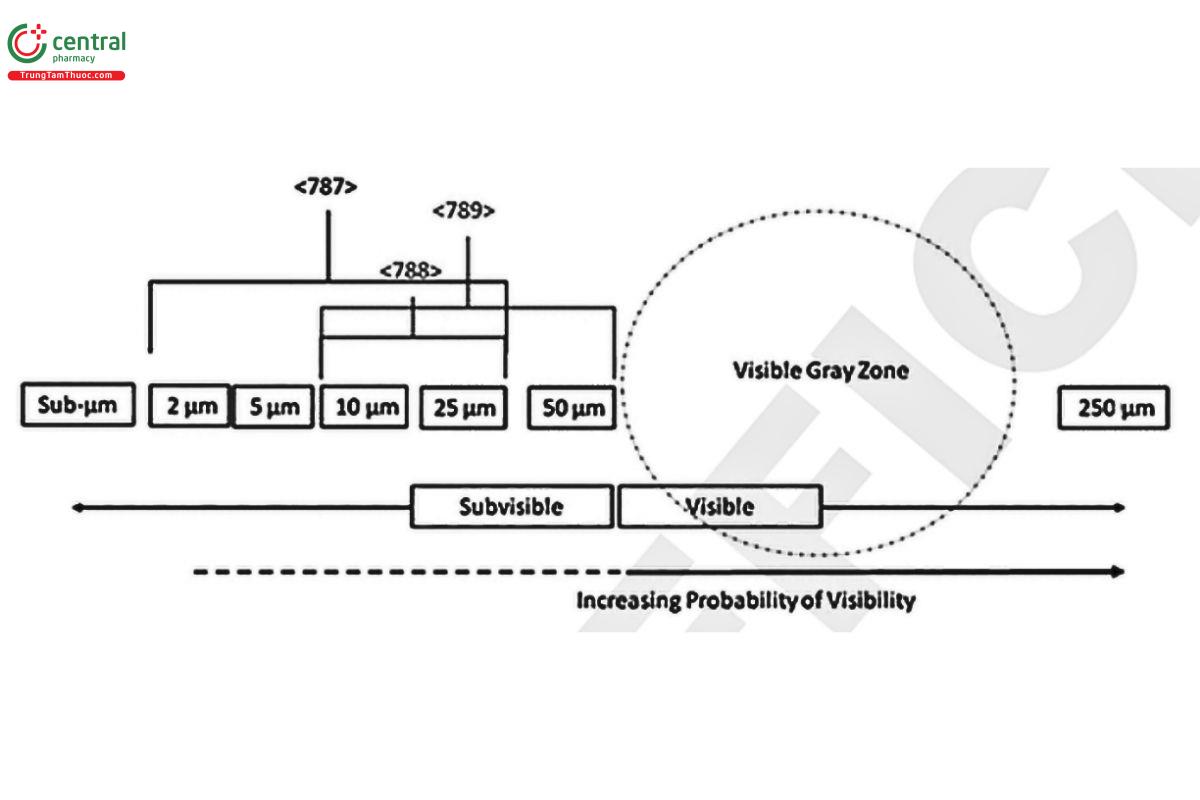
Figure 1 provides a schematic overview of the size ranges within the scope of (787), (788), and (789). Brackets indicate the range of lower size limits requiring particle concentration determinations for each of these chapters. The "Visible Gray Zone" refers to the size range where particle detection by visible inspection is probabilistic, with the probability of detection falling to zero near 50 µm.
6 PARTICULATE MATERIAL EVALUATION
For all particle determination efforts, and ultimately to reach a comprehensive control strategy, it is necessary to understand the category, if not the identity, of the particle population. As described in this chapter, extrinsic and intrinsic particles may be quantified (using LO), quantified and described (using MM and FI), and isolated (using MM) for further analysis.
For extrinsic and intrinsic particle varieties, it is recommended to use a database consisting of an internal particle library that provides particle references. The database is a key component of particle classification, risk assessment, and the ultimate identification. Some public domain and vendor databases are available, but the best database comes from compilation of particle species from your own operations.
Evaluation of the inherent particle-population baseline will utilize (788), techniques but also those described in (1787). For protein therapeutic drugs, establishment of the inherent baseline of proteinaceous particles is necessarily important and has been discussed in detail (17).
LO provides only particle concentration for specified size bins. Although these data are valuable for tracking product quality and manufacturing consistency, LO does not differentiate among particles based on particle types. Both MM and Fl provide additional information on particle attributes other than size. Fl reveals the images of all particles streaming by the camera system and thus allows classification according to morphology and image intensity. MM not only tabulates counts but also reveals the particle image and provides an isolate for analysis after counting.
However, much more can be done to fully characterize and possibly identify particulate matter with an integrated approach using light microscopy, vibrational spectroscopy, elemental analysis, and electron microscopy (18-20). These references describe a forensic pathway of identification, and (1787), provides a review of useful techniques with their advantages and disadvantages.
Applicability of any of these tests for specific products should be evaluated using appropriate qualification steps. Qualification of the instrument should be based on frequency of use, maintenance schedule, and accuracy requirements. General guidance on performing qualification is provided in Validation of Compendial Procedures (1225), and Verification of Compendial Procedures (1226),
6.1 Final Filter Exemption
General chapter (788) provides the following: "Parenteral products for which the labeling specifies use of a final filter prior to administration are exempt from the requirements of (788), provided that scientific data are available to justify this exemption." The purpose of this exemption is to offer a mechanism to reduce the subvisible particulate burden inherent in the final drug product when the amount would exceed acceptable limits and cannot otherwise be reduced through formulation adjustments or the manufacturing process prior to use. The utilization of an in-line filter should be driven by risk benefit evaluation of the potential clinical implication of subvisible particulates for the intended user population, but not be recommended to mitigate a Current Good Manufacturing Practices (cGMP)-related product quality issue (e.g., the presence of extrinsic particles). The application of this exemption should be supported by scientific evidence sufficient to justify its adoption and generally include the composition and mechanism of formation of the particles in addition to demonstrating that process-optimization strategies failed to reduce the particle load. Labeled recommendations of filter type and size should also be supported by appropriate drug product compatibility assessments, consistency in particle removal, and clinical data as necessary. Demonstration that drug potency is not significantly affected is essential. An associated risk assessment is strongly encouraged to evaluate the potential clinical implications to the intended user populations if a final in-line filter is not utilized.
7 USP SUBVISIBLE PARTICLE LIMITS
Current limits for (787), and harmonized (788) methods are set at maximum allowable particles per container or particles per unit volume at size thresholds ≥10 and ≥25 µm. These limits are historical and have changed over time based on method development and species of concern. Chapter (789) applies the 10-and 25-µm thresholds as well, plus a 50-µm threshold. In (789), the limits are provided only on a per milliliter basis. Chapter (771), provides the direction for the testing of ophthalmic products, using (787), (788) or (789) limits, based upon product application.
The calculation of allowable particle content is based on product volume (as determined by the manufacturer) for the SVI market, and on a particles-per-milliliter basis for the LVI market. However, these limits are generous, and actual particle loads are often an order of magnitude below them. All efforts to reduce particle load and maintain a consistent low-particle contribution are encouraged.
Table 2. (788) Particle Content Limits
| Technique | ||||
| Technique range | LO | MM | ||
| 2–500 µm | 5 µm to several millimeters | |||
| Particle size | ≥10 µm | ≥25 µm | ≥10 µm | ≥25 µm |
| SVI ≤100 mL | 6000/container | 600/container | 3000/container | 300/container |
| LVI >100 mL | 25/mL | 3/mL | 12/mL | 2/mL |
[NOTE-Chapter (787), limits the total content of particles in LVI products to 6000 particles ≥10 µm and 600 particles ≥25 µm.]
[NOTE-For ophthalmic products, please consult (771)]
Table 2 gives the particles per container or particles per volume requirements from (788). No limits have been established for the use of Fl or for the collection of data with size thresholds <10 µm for (787), (788), and (789). As Table 2 shows, the registration limits vary according to technique and injection product volume. Furthermore, as discussed previously, the technique capabilities are certainly not equivalent across a broad range of sizes.
Particle concentration should be monitored even for samples that give results below the Table 2 limits. Although technically within USP specifications, particle content in a single container near the limit may be a concern and may indicate problems in product quality. Results that are out of trend with what is normal for a product, even if well below the specification limits, would be of concern as well and should also be investigated. The use of additional analytical methods and the imparting of controls specific to the medication and dose are important extensions of this guidance.
The Table 2 particle concentration limits are often significantly higher than the particle concentrations observed with many commercial products. The limits apply both at time of release and at the end of shelf life, and they apply to a range of product types, from the simplest (e.g., sterile water in an ampule) to the most complex formulas with stability issues. As mentioned in 1. Introduction, this is a limit based on historical experience; internal target choices, discussed in 8.1 Development, allow for consideration of product histories, product types, therapeutic uses, and patient populations.
The intent of these tests is to provide a control strategy framework for designing the most stable formula, selecting the most stable and inert package, and employing an elegant fill/finish in a high-quality, state-of-the-market factory. The limits are imposed as a minimal standard of control, with the intent that the innovator, contract manufacturing operation, or generic producer will meet and exceed this standard across all injectable dosage forms, as appropriate to ensure high product quality. A strategy to achieve these goals is discussed in 8. Control of Particulate Matter.
8 CONTROL OF PARTICULATE MATTER
It is the intent of (1), that in the design of formulations, selection of packages, and final assembly of packages, a stable final product is attained. Using the methods and limits in (788), and (789), high-quality commercial product cleanliness and stability are verified. This state can be described as "clean" (few particles) and "stable" (avoiding changes that promote particle growth). Process streams, equipment, filling lines, pumps, staging tanks, personnel gowning, packaging cleanliness, and environmental quality all may contribute particulate matter to the product. Insufficient cleaning of product components and inappropriate selection of both container-closure systems and formula components may contribute to immediate and long-term generation of particles. Intrinsic sources of detectable particulate matter may be present but not yet evident until particles form over time, sometimes long after lot release. This should be assessed by performing drug stability studies, and subsequently controlled in the commercial product.
8.1 Development
Due diligence using particle detection methods endorsed by USP or alternate method strategies (new methods, not in USP-NF) for the best product design is recommended during product and process development and may be continued in selected evaluations during commercial production. The use of many methods early in development is an important consideration for limiting the number of particles in the product and for full understanding and characterization of the particle population.
To accomplish this, start early and conduct analyses often, using methods appropriate to the product development phase (11). Analysis using only lot release methods will give a limited understanding of the particle population. As the development cycle progresses, the use of orthogonal techniques provides greater confidence in particle assessment. It is important to explore the incidence of change in the number of particles during early phases of development to provide the optimal selection of formulation, manufacturing process, and packaging. Also, prior to commercialization, the character of inherent solids must be fully explored to establish the range of its acceptability.
Particles may form during manufacturing or over time due to any one or more of the following factors:
Formulation instability
Package cleanliness
Package selection (quality/stability)
- Inorganic extracts
- Organic extracts
- Product-package interaction
Process contributions
- Stresses throughout the process (e.g., pH swings, surface exposures)
- Inorganic extracts
- Organic extracts
Silicone content
When evaluating particle data, consider the basis for size and number generation as well as the types and sizes of particles that each technique can or cannot reliably detect. Also consider when a change of particulate amount and/or distribution is or is not significant. Likely it depends upon the basis of the technique and its demonstrated precision for quantification of the particle type of interest. Important considerations are matrix and particle character such as opacity, density, color, refractive index, shape/morphology, and true nature (e.g., liquid, matrix-aggregate, agglomerate). Results should be qualified by known standards matching the particle type(s) of interest to the extent feasible. In the case of interfering particle populations (e.g., silicone droplets interfering with counts of protein aggregates), qualification may include measurement of two single-component populations and mixtures of these.
The chosen target specifications unique to a product are an important extension of the USP limits in Table 2. In the implementation of a target-specification strategy, several tenets apply:
- Understand and minimize inherent particle load when appropriate
- Minimize intrinsic particle load
- Identify and characterize particles during development, and establish a particle database
- Correlate particle load to visible particle rejects
- Track the particle population within product families and across historical batches to reveal anomalous trends and initiate remediation
- Establish targets for particle content relevant to product family, including considerations of manufacturing arena, packaging, and formulation complexity
8.2 Statistical Sampling Plan
Chapter (788), provides the sampling plan according to product volume, while (787) emphasizes a statistically relevant sample plan independent of volume. For all products, regardless of volume, comprehensive experience regarding the integrity and consistency of the batch is gained throughout development by analyzing a number of samples throughout each batch. Experience obtained during product development indicates the proper sampling plans to be applied in commercial production to ensure that sample selection is representative of batch quality. All batches must have sampling plans that accommodate desired statistical measures of batch quality and facilitate process control. Earlier stages of drug development will require less statistical precision than late-stage development or release. The sampling plan should consider the statistical precision of the obtained counts, the likely heterogeneity within a vial or other vessel, the likely heterogeneity between vials or other vessels, and variations in particle concentration with time or other variables.
A combination of individual and pooled counting data should be considered in statistical evaluations to provide confidence in commercial release testing. For example, during development, primary consideration is given to formulation stability, because production is usually in smaller batches and not in the final at-volume commercial arena. Ideally, all containers contain the same low level of particulate matter; however, there are conditions that promote heterogeneity or, more specifically, produce containers with higher particle load than average.
These conditions include the following:
1. Insufficient or inconsistent container washing
2. Particle load on the stoppers
3. Variations in silicone coater performance
4. Particles contributed by the filling equipment (particle load may vary from pump to pump)
5. Particles contributed by the drying/sterilization system
6. Failure of aseptic filling conditions
7. Self-association of active ingredient or formulation components
8. Particles generated over time, due to formulation instability or product-package interaction. Inherent particles have been observed to have highly non-repeatable growth kinetics such that one vial may have a single large particle while other vials of the same lot have multiple small particles.
Chapter (788), provides a sampling plan according to product volume. This plan is based solely upon the limitations of traditional optical counting instruments for adequate, multiple-sample aliquot draws. Originally, the sample volume for the LO method was set at 25 mL and maintained for years, primarily due to the limited capability of the then-primary instrument, the high-accuracy particle counter (HIAC), to draw 5-mL sample volumes. Collecting sample aliquots for averaging provided a single value for the batch. Accordingly, the same sample volume was maintained for MM, but this volume was not due to a method restriction. Due to the current capability of MM to process any liquid aliquot regardless of volume, a wide range of sampling volumes can now be accommodated.
In the current analytical instrument market, much smaller sample-volume draws are accurate and precise for optical particle counters and other techniques. Additionally, due to the expansion of dosage forms to include very small volumes of a highly concentrated drug, and the cost of certain pharmaceutical drug products, there is compelling stakeholder interest in allowing much smaller sample aliquots such as those described in (787).
Unit variability is an important quality parameter 1) during development of the formulation; 2) after process changes, such as container or stopper washing or fill-arena changes; and 3) when changing package vendors. Evaluation of the non-pooled vials can give a better measure of inter-vial variability and also can eliminate the introduction of particles in the pooling process. However, use of smaller sampling volumes must be balanced by batch sampling, which will provide adequate statistical power for evaluation of acceptability.
For all products, regardless of volume, comprehensive experience regarding the integrity and consistency of the batch is gained throughout development. This allows the proper batch sampling plans to be applied for commercial production to ensure that sample selection is representative of batch quality. All batches must have sampling plans that accommodate desired statistical measures of batch quality and facilitate process control, regardless of volume tested or method used (e.g., (787), (788), or (789)). The FDA provides sampling plan guidance (21-22), and guidance is also available from ISO (23) and ANSI (24).
Final unit variability should be minimal. While 100% visual inspection is a comprehensive check for the entire batch, it is limited to fill color, fill haze, and larger particles in the fill. Subvisible particles are only visible when large numbers produce light blockage and scatter. There is low probability of visibly detecting particles <100 µm.
The above factors account for heterogeneity of the sampled particle load. Lack of repeatability in the particle measurement process introduces additional variability. Differences in sample preparation by different analysts can cause substantial variation in count, especially for samples sensitive to handling. Repeatability studies using samples similar to the samples of interest, rather than polystyrene microspheres, will give a more accurate assessment of measurement repeatability.
8.3 Risk-Based Approach
The USP limits in Table 2 mirror the historical approach of obtaining particle concentrations above given size thresholds and treating all particles as equivalently deleterious to product quality. However, the increased variety of particle types in modern pharmaceuticals, each with different risk factors, suggests that a better approach would be to identify the particle concentrations of the component subtypes of the total particle load and to then assess the risk to product quality posed by each particle type.
For example, the presence of extrinsic particles could be evidence of a breach in sterility, with a high product risk. Increases in intrinsic particle load may be associated with the production process and/or package-related sources, which can be indicative of systemic problems. Conversely, the presence of air bubbles is not a concern.
Risk for elevated final product particulate levels will be reduced when there is deep product knowledge and when systems are utilized to control the process stream in the reduction of particle load (type). Consideration should also be given to the following:
- Package selection with regard to formulation (stability)
- Package source and preparation quality (removal and addition)
- Product-contact surfaces (particle load and extractable substances)
- Filling arena cleanliness and practices (addition)
- Formulation design (stability)
Successful risk analysis may require considerable particle characterization, beyond what can be achieved by LO, MM, and FI, and utilization of prior knowledge (25).
9 SILICONE DROPLETS AND AIR BUBBLES VERSUS NON-SILICONE PARTICLES
With the historical use of a single optical particle counting approach (LO), there was high reliability, reproducibility, and throughput for the quality control lab analysis of particle load. However, the technique does not provide differentiation between solid, liquid, and gaseous matter initiating the counting pulse. Both Fi and MM can be useful adjuncts to LO in distinguishing air bubbles and silicone oil droplets from other particle types.
Certainly, the content of gas bubbles identified as counts by a particle counter may be considered an artifact of the formulation and/or sample preparation and may be alleviated or negated by sampling or preparation methodology or data manipulation. The counts by optical methods of immiscible liquids, which are largely composed of the ubiquitous silicone lubricants in pharmaceutical articles, must be considered. For some dosage forms such as cartridges, syringes, and some devices, lubrication (usually by silicone oil) is necessary.
There is a difference of opinion regarding the relative risk posed by silicone oil droplets. These opinions range from "no risk"-based on the droplet sterility and on the long history of medical use and patient exposure to silicone oil-to "potential concerns' about the increased immunogenicity of biologic drugs. Immunogenicity would arise from possible interactions between the droplets and the protein, resulting in an increase in protein aggregation or the silicone oil acting as an adjuvant. This is an active area of research. Regardless of the acceptability of the presence of high levels of silicone oil, an analytical strategy to accommodate and explain the presence of silicone droplets must be achieved by selection of the instrumental technique and methods applied during counting.
Historically, MM was used as a "referee" method to resolve the occurrence of elevated LO particle counts by verifying whether the counts were due to solid particles rather than gases and liquids. With the addition of Fl, it is now possible in many cases to begin to resolve and differentiate gases and liquids counted as particles from the semisolid to solid particle fraction. Even in those cases where the differentiation of air bubbles and silicone oil from other particles is imperfect, the partial differentiation obtained with FI can provide useful guidance for optimization of sample handling and assessment of comparability of the protein particle population.
Air and immiscible liquids do not affect the membrane count. Membrane surface artifacts and semisolid particles can, however, complicate this analysis, while many protein samples spread out on the surface such that they are not detectable. This procedure is also time consuming and difficult to reproduce, requiring extensive operator training. It is usually only applied to biologics when identification of foreign particles is performed during development of nonconformance investigations.
10 CHALLENGING SAMPLES
Alternate methods may be necessary for dosage forms for which (788), cannot be directly applied. This includes some of the sample types described in 5. Applicability of Methods (e.g., process streams, vehicles, or components). Alternate methods and/or evaluation should be considered for dosage forms and process samples for which optical detection is not practical.
For example, some products have inherent properties that affect or preclude particle counting so (788) methods cannot be used as written. For other products, development activity may be needed (see (1787)). Direct evaluation of container-closure rinses and product vehicles may be used for these suspension systems by the (788) methods. When the product is not a solution or is viscous or will otherwise confound the (788), methods, it must be altered or accommodated to facilitate the assay. Examples of alternate methodologies are:
- Particle determination of product after treatment with solvent to dissolve all product solids
- Use of centrifugation to separate product solids from the vehicle
- Use of selected screens or sieves to separate product solids from the product vehicle to minimize interference
- Evaluation of the product filling system by using an alternate, clear fluid such as sterile media or saline
Use the methods that are best adapted to the particle type and volume of sample. Selected sampling requires careful statistical evaluation of the batch population when using small sample volumes to evaluate product acceptability, this applies to all methods. Regardless of the sample size, the number of samples tested should be determined statistically based on acceptable risk and development history.
11 FACTORS AFFECTING ALL METHODS
11.1 Guidelines for the Use of Calibrator Spheres
11.1.1 GENERAL
Polystyrene spheres of stated diameter, or stated diameter and concentration, are commercially available for calibrating particle counting instruments. All such standards are only valid if the spheres are predominantly unaggregated. When measuring particle mean diameter, particle concentration, or instrument resolution, the user should inspect the particle size distribution to confirm the absence of microsphere aggregates. Aberrant calibration results may be due to instrument or method problems or calibrant quality. If there is evidence of aggregation, the bottle of calibrator spheres used should be discarded. Any results obtained from a vial that has demonstrated aggregation of spheres should be disregarded, as long as a satisfactory result with a new source of spheres is obtained. If the instrument is running properly but the calibration results deviate from the manufacturer's specifications, and the calibrator spheres show no indication of aggregation, the manufacturer of the instrument should be consulted.
11.1.2 SPECIFIC STANDARDS
Chapter (788), specifies the use of mono-sized dispersions of traceable spherical particles with known diameters that include the 10-and 25-um required sizes for particulate-matter testing. This must also include an expanded range of sizes to cover the calibrated range between 2 and 100 µm. The calibration curve should include additional sizes such as 2, 5, 10, 15, 25, and 50 µm, especially when particle load data are expected outside the traditional (788), thresholds. All particles are suspended in particle-free water (do not use Water for Injection), with small amounts of surfactant and preservative allowed.
Each calibrator sphere size should have a mean diameter within 5% of the nominal diameter and should be traceable to National Institute. of Standards and Technology (NIST) standard reference materials or certified reference materials from other national metrology institutes.
The concentration of calibrator microspheres may be certified by the manufacturer or by the user via MM or other methods (26). For an MM determination of particle concentration, pipet a volume of the suspension containing 250-500 particles into a filter funnel. After drying the membrane, count the total number of standard spheres collected on the membrane filter. The size calibration should be done with the same standards. It is very important to calibrate for both size and number of particles, as the accuracy of one can influence the other.
11.2 Elements of Measurement Quality Control
Quality control of measurements is ensured by a hierarchy of activities. See 11.3 Validation Considerations for All Techniques.
This topic can be generally summarized as the following:
- Method validation ensures that the chosen method will reliably measure the quantity of interest at known levels of accuracy, precision, and specificity (see (1225))
- Instrument qualification verifies that a particular instrument is fit for purpose (see Analytical Instrument Qualification (1058))
- Instrument standardization tests (ISTs) are the historical parameters of control for LO and are described in this chapter
- System suitability tests (SSTs) are routine and usually single-pass measurements performed to demonstrate a high degree of confidence that the instrument is performing correctly in use. The SST contained in this chapter for LO is a series of tests that demonstrates that each parameter complies with the manufacturer requirements.
Elements of method validation will be discussed for each technique; however, each method should include an assessment of the following:
- Recovery
- Accuracy
- Precision
- Specificity
- Lower detection limit
- Upper detection limit
- Sampling volume
- Linearity/range
For all the methods, there are general laboratory and sample considerations. First, remember that the main objective is to determine the level of unwanted particulate matter in a final parenteral product. The handling of the article during setup, selection, preparation, and testing should not significantly affect the results. For articles with a higher resident particle load, the impact of handling and area cleanliness is not as pronounced; however, the same general, clean, systematic approach must apply for all samples. See Appendix 2 for further details on cleaning procedures.
As described in (788), determine the particulate matter in 5 samples of filtered water, each with a volume of 5 mL (or a blank volume that is equivalent to the sample volume for your specific method). For the 5-mL blank volume, if the number of particles that are ≥10 µm in size exceeds 25 for the combined 25 mL (NMT 1/mL), then this indicates that the precautions taken for the tests were not sufficient. Achieving a low number in the blank verifies that the equipment, operations, and sample residuals are not contributing significant counts. This is most important for (789) operations, which have strict limits. This guidance provides a practical limit for all methods, as it demonstrates insignificant impact of the operations for article preparation, glassware, sample handling, and instrument/apparatus cleanliness. Having a low-traffic, designated area for particle counting operations is recommended but may not be necessary depending on the method and the sample condition. Finally, when utilizing any technique for (789), the blank test should be considered carefully, as the limits are more restrictive than for (787), and (788), and there is an additional size threshold, ≥50 µm, to consider. Blank counts for (789), should be consistently very low to zero within a properly configured lab and using clean equipment and glassware.
11.3 Validation Considerations for All Techniques
Although the (788), methods are deemed robust for most product forms, deviation from clear, noncolored, and waterlike formulations may need further study. At the very least, an alternative particle counting strategy and a recovery study with known particle size standards will demonstrate the performance of the method for a specific medium. As described in the rest of this chapter, orthogonal methods may be necessary to fully understand the properties of the product. The following guidance is useful for comprehensive evaluation.
Chapter (1225) and ICH Q2(R1) (27) provide comprehensive guidance for validation of analytical procedures, as do the IST routines endorsed by the vendors. The aspects of assay validation in these guidelines are as follows:
- Chapter (1225): Accuracy, Precision, Specificity, Detection limit, Quantitation limit, Linearity, Range, Robustness
- ICH Q2(R1): 1. Specificity, 2. Linearity, 3. Range, 4. Accuracy, 5. Precision, 6. Detection limit, 7. Quantitation limit, 8. Robustness, 9. System Suitability Testing
- IST for LO: Light Obscuration Method for the Determination of Subvisible Particulate Matter (1788.1), 3. Instrument Standardization Tests. 3.1 Sample Volume Accuracy, 3.2 Sample Flow Rate, 3.3 Diameter Calibration, 3.4. Sensor Size Resolution, and 3.5 Qualification Considerations
Validation requirements are discussed in (1225). However, for a limits test such as the testing described in (788), it has been common and acceptable in the US to use the following for evaluation of performance:
- IST as described in 13. Instrument Standardization Tests
- Particle count reference standard compliance for counts conducted daily, weekly, monthly, or quarterly
- Spiked recovery studies to verify optimal sample preparation, mixing, and presentation
Both LO and MM methods provide a robust and reproducible particle content determination. Many companies have collected these data over an extended history, and the data are appropriate for most product formulas as written. Clear, low-concentration formulations that mix easily often require no further method modifications for validation. However, verifying acceptability for specific product families is an important step. Interference of test-sample attributes with various particle counting methods is discussed in 4. Detection and Enumeration of Particles in Different Size Ranges. Method development as discussed in this section is a critical aspect of method validation. The fewer samples that deviate from non-labile particles in waterlike formulations, the greater the need for careful method validation.
For those formulations that are highly concentrated, colored, or viscous, or that have specific gravity significantly different from water, the effects of the formulation character will require further consideration for method acceptability. Particle-recovery and-counting linearity should be standardized and verified for test methods that require sample mixing and pooling. When this is required, the test method should use the same procedure. MM samples the entire (drained) product fill and thus has no similar sampling issues.
Chapter (1225), indicates that specificity and detection limit are necessary elements for limit tests and, depending on the nature of the test, accuracy and range are as well.
For all techniques:
11.3.1 SPECIFICITY
As discussed previously, LO instruments will count air bubbles, immiscible liquid droplets, and semisolid and solid particles. Thus, LO has low specificity, and the specificity for detecting the particles of interest should be qualified by other methods. MM is insensitive to air bubbles and liquid droplets. Fl will capture images of all bubbles, droplets, and particles. The specificity of FI can be assessed by measurement of mixtures of known particle concentrations followed by analysis with the algorithm that will also be used for the specific product.
11.3.2 RECOVERY
The use of microspheres of lower refractive index than polystyrene (such as polymethylmethacrylate or silica) or other particles of low refractive index may be appropriate to model particles of low refractive index difference for both LO and Fl. In all cases, the ability of the method to accurately report the number of particles within the assigned sizing bins should be determined.
11.3.3 LINEARITY AND RANGE
Linearity and range can be assessed by the measurement of microsphere mixtures at different dilutions followed by comparison of the measurement result with the particle concentration expected from the known dilution factor. All three methods are subject to coincidence errors in which two particles appear as a single particle. LO method has typical coincidence errors of 10% at particle concentrations ranging from several thousand to a hundred thousand particles per milliliter, depending on the sensor choice. Typical Fl instruments have much lower coincidence errors than MM or LO. For all methods, coincidence errors will depend on the nature of the particle size distribution, with larger errors for a size distribution with larger particles. The range extends from the level of background counts observed to the highest concentration with acceptable coincidence error.
11.3.4 ACCURACY
For particle counters, there are two types of accuracy that must be assessed: accuracy of reported diameter and accuracy of reported particle count. Both may be assessed at a basic instrumental level by measuring microsphere suspensions of known diameter and/or concentration. However, LO, FI, and MM will all report different diameters, even if the instruments have been properly calibrated to give accurate diameters with microspheres, because of the different dependencies of the instruments on particle morphology and refractive index. In every case, 2-dimensional images are being used to describe a 3-dimensional object.
While there is no consensus method for adjusting the reported diameter to a corrected diameter that addresses these effects, there are some methods that can be helpful in understanding them.
Silica and polymethylmethacrylate microspheres have lower refractive index than commonly used polystyrene microspheres.
Suspensions of these microspheres in glycerol/water solutions, or in other liquid mixtures of tunable refractive index, can be used to study the change in reported diameter with change in the refractive index difference between the particle and the matrix fluid.
Polydisperse suspensions of particles that optically mimic protein aggregates are in development. Use of these suspensions will be helpful for understanding the response of instruments to irregular particles of low optical contrast. Typical protein aggregates, for example, have an average refractive difference from the matrix fluid of only approximately 0.02 for sizes ≥2 µm.
Currently, there are two fundamental limitations on correcting errors of reported diameter. First, the refractive index of certain common particles such as protein aggregates is not yet established. Second, there is no accepted method for correcting diameter errors for heterogeneous mixtures of particles (e.g., silicone oil droplets and protein aggregates in a single test sample).
11.3.5 PRECISION
Precision may be assessed by considering the repeatability of multiple assays. Assays performed with microspheres or microsphere mixtures may be useful for assessing the fundamental precision limit of a method. Assays performed with samples representative of actual particles will provide a more accurate assessment of the precision that is possible in regular use.
11.3.6 DETECTION LIMIT
The detection limit is usually defined as the particle concentration corresponding to a 3:1 signal-to-noise (S/N) ratio. Particle counters may be theoretically capable of counting single particles without ambiguity, but noise is introduced in the form of background counts seen with blank or filtered buffer samples. The detection limit will vary with the size of the particle.
11.3.7 ROBUSTNESS
Assay results for particle counts can be sensitive to sample preparation, sample variability, and instrument cleanliness for all methods. MM is especially dependent on operator judgment.
12 TEST ENVIRONMENT AND PREPARATION
The nature of the sample preparation and the analytical method used can substantially alter the environmental requirements. Especially for MM, the pooling of aliquots, and other procedures requiring sample manipulation or samples exposed to the environment, will require more attention to cleanliness than procedures that only require drawing samples out of a vial as for LO. In all cases, perform the test in an environment that minimizes background particulate matter. Glassware must be cleaned to the extent that the level of particles added by testing has a negligible effect on the outcome of the test. Methods are acceptable as long as blank samples or other negative controls provide good results.
12.1 Sample Handling
Best practices for minimizing particle contamination from packaging or the testing environment should be followed at every step. Remove tertiary and secondary packaging outside of the test area and ensure that the exterior of the product containers has been cleaned. Rinse the exterior of containers with filtered water after removing all retention hardware (e.g., ferrules, clips, bands) and as directed in 12.2 Sampling Practices for each technique. Protect the containers from environmental contamination until analyzed.
12.1.1 LIQUID PREPARATIONS
Prepare the container(s) as directed in (788), Method 1 Light Obscuration Particle Count Test, either pooling units to get the 25-mL test aliquot when using (788), or testing individual units if using (787). When using (788), for containers of 25 mL or more, simply open the container, insert the counter probe in the middle of the solution and measure. For all liquid samples, gently mix the samples by hand swirling, gentle inversion, or mechanical means. Care should be taken to avoid introduction of air bubbles or contaminants and to avoid disruption of particles in all cases.
12.1.2 DRY OR LYOPHILIZED PREPARATIONS
Prepare the containers as directed under (788). Method 1 Light Obscuration Particle Count Test. Open each container, taking care not to contaminate the opening or cover, Reconstitute as directed by the product insert instructions, allowing time for the sample to stand if so directed. Alternatively, during product development, prior to the availability of the package insert, use conditions as close as possible to those expected at the point of administration or use.
Replace the closure and manually agitate the container sufficiently to ensure dissolution of the drug, being careful not to agitate too vigorously and cause particle formation. For some dry or lyophilized products, it may be necessary to let the containers stand for a suitable interval and then agitate again to achieve complete dissolution. After the drug in the constituted sample is completely dissolved, prepare the units as directed in 12.1.1 Liquid Preparations. Gently stir the contents of the unit by hand swirling or by mechanical means to mix and suspend any particulate matter. Proceed as directed for the appropriate unit volume under the applicable USP chapter. When sampling, ensure that the sipping probe is inserted into the middle of the solution.
12.1.3 PRODUCTS PACKAGED WITH DUAL COMPARTMENTS TO HOLD THE DRUG PRODUCT AND A SOLVENT IN SEPARATE COMPARTMENTS
Prepare the units to be tested as directed under (788), Method 1 Light Obscuration Particle Count Test and according to product insert directions. Mix each unit as directed in the labeling, activating and agitating it to ensure thorough mixing of the separate components and to ensure drug dissolution. Prepare as described in (1788.1), 6. Blank and Sample Handling, and proceed as appropriate.
12.1.4 PRODUCTS LABELED AS "PHARMACY BULK PACKAGE NOT FOR DIRECT INFUSION"
Proceed as directed for Liquid Preparations where the volume is 25 mL or more. Calculate the test result on a portion that is equivalent to the maximum dose given in the labeling. For example, if the total bulk package volume is 100 mL and the maximum dose volume is 10 mL, then the average LO particle count per milliliter would be multiplied by 10 to obtain the test result based on the 10-mL maximum dose. [NOTE -For the calculations of test results, consider this maximum dose portion to be the equivalent of the contents of one full container.]
12.2 Sampling Practices
After proper mixing, open the container(s) and pour or withdraw by syringe the contents under test to transfer in a manner least likely to generate particles. The number of product samples is determined by the fill category (small volume or large volume) or the intent of the determination, such as container variation or batch matrix experiment (BME) or design of experiment (DOE).
- Direct sampling-Contents of containers with removable stoppers may be poured out directly after removing the closures for MM.
- Products packaged in flexible plastic containers may be sampled by cutting the medication or administration port tube or a corner from the unit with a suitably cleaned razor blade or scissors. Sampling devices that have a needle to penetrate the unit closure may also be used for all three methods. With an appropriate instrument "sipper", the contents of the product package may be directly drawn for LO or Fl analysis.
- Pooling-If there is insufficient volume for the test method, the contents of multiple containers may be pooled from freshly opened product into clean glassware (cleanliness verified by testing).
- Reconstitution-Dry or lyophilized products must be constituted using either their insert diluent or particle-free water (as desired). The closure is removed to add the fluid, which is injected via hypodermic syringe. If test specimens are to be pooled, allow each to constitute fully before sampling directly or pooling.
- Dilution-Some products will require dilution for LO or FI analysis due to insufficient volume or due to suboptimal fluid properties, such as color or viscosity. All MM procedures utilize particle-free water as a receiving and rinsing fluid, thus they are diluted by design. The diluent must be particle-free water (or filtered product vehicle) and dilution vessels must be scrupulously cleaned and verified. The impact of dilution must be evaluated for acceptability through feasibility studies. Feasibility is verified when it is demonstrated that the dilution does not dissolve resident particles and, more importantly, does not induce formulation change.
12.2.1 MIXING
For reference standards, such as the USP Particle Count Set RS (used for system suitability particle count accuracy, recovery studies, or calibration), homogenization of the mixture may be attained by agitating the preparation for 20 s and sonicating for up to 30 s. Mixing of most product samples will require different handling than that for the standard.
Gently mix the contents of the sample just prior to analysis by hand-swirling, tipping of the vial, or mechanical means. Take care not to introduce air bubbles, or if open, contamination. Mixing of samples is necessary to resuspend settled particles; however, mixing must be done carefully, because agitation may alter fragile or shear-labile particles. Swirling is gentler than tipping the vial but may not resuspend all particles. To the extent feasible, confirm on the sample of interest that the mixing method produces an acceptably homogeneous sample and that multiple stirring operations do not introduce unacceptable shifts in the particle size distribution.
12.2.2 DEGASSING
The handling of microspheres and some blanks is different from the handling of some test samples. Microspheres will not degrade under sonication; however, sonication will strongly affect some particle types and is never acceptable for protein-containing solutions.
Use a consistent degassing procedure appropriate for the samples. For protein-containing solutions, sonication must be avoided. Recommended degassing procedures include 1) sonication at 20-80 watts for about 30 s, 2) standing and equilibrating at room temperature for 10 min, or 3) applying a mild vacuum, e.g., 75 torr, for 10 min. The standing of the sample can result in particle stratification and/or settling; thus, a sufficient and gentle agitation should be applied before analysis to bring all particles into the sampling zone. For cases where procedure 2 is ineffective, such as viscous samples or gas-particle associations, gentle vacuum may remove these entrained bubbles without disrupting the inherent particle population.
There are caveats to sonication and standing. With sonication, much energy is dissipated as heat, resulting in denaturation of the biologics; this could also affect certain particles in the sample. Allowing the sample to stand to dissipate gas is effective, but stratification and settling of particulate matter occurs during standing. For this reason, use of the standing approach must be accompanied by sufficient gentle agitation to bring all particles into the sampling zone. Allowing the sample to stand also has the benefit of bringing the solution to room temperature, mitigating any thermal effects encountered when introducing the sample to the counting system. Sometimes, allowing the sample to stand is not sufficient to remove microbubbles (e.g., if the solution is viscous or if the air bubbles associate with the particles). Gentle vacuum can often remove these entrained bubbles without disrupting the inherent particle population.
12.2.3 BLANK SAMPLES
For the (788) method, an environment blank verifies system cleanliness. To collect blank counts, use a cleaned vessel of the type and volume to be used in the test. Place a defined volume of filtered water consistent with the volume of sample to be counted in the vessel and agitate the water sample in the cleaned glassware by inversion or swirling. Using the same method as for product samples is recommended.
Best practice includes running additional blank samples, especially between product families. Measurement of additional blanks consisting of filtered formulation buffer may be useful for assessing the introduction of air bubbles or desorption of particles from wetted surfaces in surfactant-containing formulations.
13 INSTRUMENT STANDARDIZATION TESTS
ISTs are used to verify that the instrument performs in accordance with the manufacturer's specifications upon calibration and continues to provide accurate and consistent results between calibrations. ISTs, as described in 13. Instrument Standardization Tests, are equivalent to the performance qualification (PQ) in (1058) and are intended to verify the acceptable performance of the instrument for its intended use. See (1058) for an in-depth description of PQ, operational qualification (OQ), and system suitability. These tests are also applicable for MM but in a much-simplified approach (see Membrane Microscope Method for the Determination of Subvisible Particulate Matter (1788.2)).
ISTS for LO and Fl include several tiers. Instrument calibration is the most comprehensive set of tests, and PQ tests provide assurance that the instrument meets all key performance requirements. Other verification tests provide daily assurance that the instrument performance is acceptable.
13.1 Diameter Calibration
Perform instrument calibration according to the instrument manufacturer's instructions. The count accuracy of an instrument can be significantly affected by the size accuracy of the instrumental particle counter. Count accuracy is also dependent upon the sensor used and may vary with individual sensors of the same model, as described previously.
Perform a system suitability test upon completion of the instrument calibration to ensure that the particle sizes of interest for the application (i.e., 10 and 25 µm) and other sizes (e.g., 5 and 15 µm), are accurately reported and that the count accuracy is verified. Count accuracy should be performed during or after the diameter accuracy is confirmed. Particle count accuracy may be assessed using commercial microsphere count standards. For LO and FI, corrections are incorporated into instrument software to give accurate particle diameters of the calibration microspheres.
13.2 System Suitability Tests
The key attributes of a particle counting system are that it counts particles accurately and that the level of background counts is acceptably low. Count accuracy may be assessed by routine measurement of microsphere count standards. Background counts may be assessed by routine measurement of blanks or filtered formulation. These two types of tests are the core system suitability tests.
A few factors influence how often a system suitability test should be run:
- Do the test samples tend to clog flow cells in the LO and Fl methods?
- Do the particles in the test sample tend to adhere to wetted surfaces, thereby causing increased counts in subsequent blanks or test sample runs?
- What are the consequences if assay failure is detected at a date later than when the assay was run?
13.2.1 SYSTEM SUITABILITY FAILURE
Instruments that fail system suitability tests can often be remediated by thorough cleaning or by evaluating the particle standard used (these can aggregate over time). If failure of the standard is ruled out, the manufacturer's directions should be followed for thoroughly cleaning all fluid lines and the sensor head. Back-flushing to remove partial clogs may also be beneficial. The instrument is deemed to be suitable for use if it passes the system suitability tests after cleaning. Flush the system to remove traces of the particle standard prior to routine use.
Depending upon the dosage form being tested, proceed as directed under the appropriate category in 14. Calculations.
14 CALCULATIONS
14.1 Pooled Samples
Average the counts from the aliquot portions analyzed. Calculate the number of particles in each container:
PΣ≥10VT/VAn
PΣ≥25VT/VAn
PΣ≥50VT/VAn
in which PΣ≥10 is the average particle count per threshold obtained from all portions analyzed and PΣ≥25 is the average particle count per threshold obtained from all portions ≥25 µm analyzed. [NOTE-PΣ≥50 is additionally used for (789). VT is the volume, in milliliters, of pooled sample; VA is the volume, in milliliters, of each portion analyzed; and n is the number of containers pooled.].
14.2 Individual Samples
Average the counts obtained for the aliquot portions from each separate unit analyzed and calculate the number of particles in each container:
PΣ≥10V/VA
PΣ≥25V/VA
PΣ≥50V/VA
in which PΣ≥10 is the average particle count per threshold obtained from all portions analyzed and PΣ≥25 is the average particle count per threshold obtained from all portions 25 µm analyzed. For (789), PΣ≥50 is also reported and is the average particle count per threshold obtained from all portions ≥50 µm. V is the volume, in ml, of the tested unit and VA is the volume, in ml, of each portion analyzed. For individual unit samples measured directly, the results are reported as PΣ≥10 or PΣ≥25 per unit volume, such as counts per milliliter.
14.3 Individual Unit Samples
Average the counts obtained for the aliquot portions taken from the solution unit. Calculate the number of particles in each milliliter of product solution taken:
PΣ≥10/V
PΣ≥25/V
PΣ≥50/V
in which PΣ≥10 is the average particle count per threshold obtained from all portions analyzed and PΣ≥25 is the average particle count per threshold obtained from all portions 25 µm analyzed. For (789), PΣ≥50 is also reported and is the average particle count per threshold 250 obtained from all portions ≥50 µm. V is the volume, in milliliters, of the portion taken.
For all types of product, if the tested material has been diluted to decrease the viscosity, the dilution factor must be accounted for in the calculation of the final test result.
[NOTE-For all methods, when reporting particle load the particle counts must be reported in cumulative mode. If the instrument has been configured to count in differential bins (e.g., 210-24 µm, >25-50 µm, >50 µm), all bins ≥10 µm must be added to yield a total ≥10-µm count and all bins ≥25 µm need to be added to yield a total 25-µm count. Reports should clearly state the diameter limits, the units of particle counts (e.g., counts per container or counts per milliliter), and that the particle loads are for all particles greater than or equal to the stated diameter limits.]
15 GLOSSARY
Diameter bias: Deviation of a derived particle diameter from the actual diameter due to technique parameters and limitations.
Diascopic illumination: Transmitted light illumination for transparent to translucent samples.
Episcopic illumination: An internal illumination path coincident with the optical path, providing top-reflected light for the detection of thin, flat particles and films.
Equivalent circular diameter: The diameter of a standard sphere that produces an equivalent electronic pulse or other signal to an analyte particle.
Feret's diameter: The dimension of an object along a specified direction, also known as caliper diameter.
Flow imaging: An instrumental system configured to collect digital images of solids in sample fluid flowing between a light source and a camera.
Fouling: Plugging or coating of a particle counting system sensor or flow cell; may be a full blockage, partial blockage, or an extraneous substance affecting the analysis.
Image analysis, dynamic: A software program used to collect images from a flowing display, store the images, and retrospectively analyze the collected data.
Image analysis, static: A software application used to collect images and discriminate the images from a live, unchanging image.
Light obscuration: An optical particle-sensing technique that records impulses on a photodetector from obscuration of a source illumination by analyte particles. Particle size correlates with the response curve of a known spherical standard.
Longest chord: The longest dimension that can be measured across the perimeter of an object.
Membrane microscopy: A particle determination method that isolates solids from product samples by filtration and then examines them with a light microscope to count the collected material in size thresholds.
Operational qualification (OQ)/Performance qualification (PQ): Essential elements of method validation: OQ specifies the principal operational elements of the device in both hardware and method controls; PQ verifies the acceptable performance characteristics for a specified instrument OQ.
Optical particle counter: An instrument that provides detection, sizing, and enumeration of substances in a fluid medium using visible spectrum illumination and an electronic detector.
Particle concentration: Number of particles (count) per unit volume.
Particle count accuracy: An evaluation of the capability of an instrumental system to collect particle counts for evaluation against a standard.
Particle size: Visible: In the context of pharmaceutical products, the size at which one can visualize a single particle within a final product package. USP has set a conservative threshold at 100 µm, which must be considered the size at which the optimal methods will reliably detect particles. The caveat for setting a size threshold is that detection by manual (human) methods is a probabilistic process. Subvisible: 2-100 μm.
Nanoparticles: <2 µm. [NOTE-The <2 µm threshold is a cut-off based on the limitation of typical instrument capabilities.]
Refractive index (RI): The numerical ratio of the speed of light through a vacuum over the speed of light through a substance. The Rl of water is 1.33, with fluid oils ranging to 1.50 and solids spanning a wide range upwards from 1.34. RI is wavelength specific.
Relative standard deviation/Coefficient of variation: A measure of dispersion of a probability distribution. It is the ratio of the standard deviation to the mean and is expressed as percentage.
Schlieren effects: These are regions of varying refraction in a transparent medium that are often caused by differences in temperature or pressure and are detectable by optical means, generally by the passage of a beam of light through the medium.
Sheath flow: A technique using a "wall" of higher-viscosity fluid encasing a lower-viscosity analyte sample flowing through it, thereby producing a limited focal plane due to hydrodynamic channels.
System suitability: A measurement of the system output with a known standard that demonstrates acceptable performance of the system, often the result of several operational parameters.
Validation: Validation of an analytical procedure is the process by which it is established, by laboratory studies, that the performance characteristics of the procedure meet the requirements for the intended analytical applications. This typically includes measurement of method accuracy, precision, specificity, detection limit, linearity, range, and robustness. Described in (1225).
16 APPENDICES
16.1 Appendix 1: Historical Development of USP Chapters on Subvisible Particulate Matter
The determination of subvisible particulate matter in injections was initiated in 1975 as an MM method for large-volume injections (LVI) in USP XV. This one method was quite effective at revealing the content of unwanted solid particles ≥10 µm in the product, because filtration could accommodate a wide range of product volumes and the microscopist could evaluate the retained solids. However, the microscope method was much slower per sample than corollary instrumental techniques and required high-efficiency particulate air (HEPA) environmental hoods for isolation operations, with special microscope count training for the analysts.
Higher throughput with a robust electronic method was sought. Historically, the British Pharmacopoeia had utilized electrical sensing zone (Coulter counter) counting for all particles ≥2 µm; however, the method required dispersion of the product in an electrolyte solution, which did not work for certain products and formulations and could require extensive particle sampling prior to analysis.
The current USP subvisible particle determination methods were established in 1986 for determination of particulate matter in sterile injections, and in 1995, an improved version of this methodology was adopted (28) following extensive development by an expert volunteer group (29). The MM method was improved, and the combination of LO and MM was proposed for use as a two-stage test for both LVI and small-volume injection (SVI) products. In (788) and (789), "small-volume parenteral" is synonymous with SVI, and "large-volume parenteral" is synonymous with LVI. SVI and LVI are used throughout this chapter. The improved method for MM became official in 1995, and the first-and second-stage methods could be used for any sterile product amenable to testing by either method. Chapters (788) (a harmonized chapter) and (789), provide two methods: an LO test (Method 1) for sizing and counting of subvisible particles (generally 2-100 µm) for nearly transparent, low viscosity ("waterlike") product samples, and an MM particle count test (Method 2) for manual particle sizing and counting as an alternate method. The MM method also retains particles for further evaluation. Barber (30) has a good review of the limits history and instrument choices.
16.2 Appendix 2: Cleaning Procedures to Limit Particle Contamination
Cleanse glassware, closures, and other required equipment, preferably by immersing and cleaning the items using warm, nonionic detergent solution. Rinse in flowing tap water, and then rinse again in flowing filtered water. Organic solvents may also be used to facilitate cleaning. [NOTE-These steps describe one way to clean equipment; alternatively, particle-free equipment may be obtained from a suitable vendor.] Preferably, the test specimen, glassware, closures, and other required equipment are then given a final rinse with filtered water using a hand-held pressure nozzle with final filter or other appropriate filtered water source within an environment protected by HEPA cabinets. While conducting the assay, non-shedding garments and powder-free gloves are worn within the HEPA environment.
For example, prepare the test specimens in the following sequence. Outside of the unidirectional airflow cabinet (UAFC) or HEPA filters to be used for the test, remove outer hardware or sealing bands. Labels typically don't need to be removed; however, if necessary, they may be removed or taped over before the next cleaning step. Rinse the exteriors of the containers with filtered water. Protect the containers from environmental contamination until analyzed.
Within the UAFC, open the containers and withdraw, pour, or otherwise sample the contents of the containers for testing in a manner least likely to generate particles that could enter the test specimen. Contents of containers with removable stoppers may be withdrawn directly by removing the closures. A sampling device with a needle to penetrate the unit closure may also be used. Products packaged in flexible plastic containers may be sampled by cutting the medication or administration port tube or a corner from the unit with a suitably cleaned razor blade or scissors.
17 REFERENCES
1. USP Validation and Verification Expert Panel. Lifecycle management of analytical procedures: method development, procedure performance qualification, and procedure performance verification. Pharm Forum. 2015;39(5).
2. Langille, SE. Particulate matter in injectable drug products. PDA J Pharm Sci and Tech, 2013;67:186-200.
3. Carpenter JF, Randolph TW, Jiskoot W, Crommelin DJ, Middaugh CR, Winter G, et al. Overlooking subvisible particles in therapeutic protein products: gaps that may compromise product quality. J Pharm Sci, 2009;98:1201-1205.
4. Singh SK, Afonina N, Awwad M, Bechtold-Peters K, Blue JT, Chou D, et al.. An industry perspective on the monitoring of subvisible particles as a quality attribute for protein therapeutics. J Pharm Sci, 2010;99(8):3302-3321.
5. Cao S, Jiang Y, Narhi L. A light-obscuration method specific for quantifying subvisible particles in protein therapeutics. Pharm Forum. 201036(3).
6. Cao S, Jiao N, Jiang Y, Mire-Sluis A, Narhi LO. Sub-visible particle quantitation in protein therapeutics. Pharmeur Bio Sci Notes, 2009:1:73-79.
7. Cavicchi, RE, Carrier MJ, Cohen JB, Boger S, Montgomery CB, et al. Particle shape effects on subvisible particle sizing measurements. J Pharm Sci. 2015;104(1):971-987..
8. Ripple DC, Hu Z. Correcting the relative bias of light obscuration and flow imaging particle counters. Pharm Res. 2016;33(3):653-672.
9. ASTM International. ASTM E3060-16. Standard guide for subvisible particle measurement in biopharmaceutical manufacturing using dynamic (flow) imaging microscopy. West Conshohocken, PA: ASTM International; 2016.
10. Bukofzer S, Ayres J, Chavez A, Devera M, Miller J, Ross D, et al. Industry perspective on the medical risk of visible particles in injectable drug products. PDA J Pharm Sci and Technol. 2015;69(1):123-139.
11. Corvari V, Narhi LO, Spitznagel TM, Afonina N, Cao S, Cash P, et al. Subvisible (2-100 µm) particle analysis during biotherapeutic drug product development: part 2, experience with the application of subvisible particle analysis. Biologicals. 2015;43:457-73.
12. Narhi LO, Schmit J, Bechtold-Peters K, Sharma D. Classification of protein aggregates, J. Pharm. Sci.. 2012;101(2):493-498.
13. Moussa EM, Panchal JP, Moorthy BS, Blum JS, Joubert MK, Narhi LO, et al. Immunogenicity of therapeutic protein aggregates. J Pharm Sci. 2016;105(2):417-430.
14. Narhi LO, Corvari V, Ripple DC, Afonina N, Cecchini I, DeFelippis MR, et al. Subvisible (2-100 µm) particle analysis during biotherapeutic drug product development: part 1, considerations and strategy. J Pharm Sci. 2015;104(6):1899-1908.
15. Aldrich DS, Cao S, Hawe A, Hunt DG, Narhi L, Ripple D, et al. Analytical gaps and challenges for particles in the submicrometer size domain. Pharm Forum. 2016:42(6).
16. Cherris R, Valley U, Aabye-Hansen L, McLean R, Overroedder D, Owen A. PDA Technical Report No. 79. Particulate Matter Control in Difficult to Inspect Parenterals. Bethesda, MD: Parental Drug Association; 2018.
17. Narhi LO, Schmit J, Bechtold-Peters K, Sharma D. Classification of Protein Aggregates, J Pharm Sci, 2012;101(2): 493-498.
18. Aldrich DS, Cherris RT, Shabushnig JG. Visual Inspection and Particulate Control. River Grove, IL: Davis Healthcare International; 2016.
19. Aldrich DS, Smith MA. Pharmaceutical applications of infrared microspectroscopy. In: Humecki H, ed. Practical Guide to Infrared Microspectroscopy. New York: Marcel Dekker; 1995;323-375.
20. McCrone WC, Delly JG. The Particle Atlas. Vol. I-IV, Ann Arbor, MI: Ann Arbor Science Publishers; 1973.
21. Sampling Plans. US Food and Drug Administration website.https://www.fda.gov/ICECI/Inspections/InspectionGuides/ucm170830.htm. Accessed 6 Nov 2019.
22. US Food and Drug Administration. Guidance for industry. Process Validation: general principles and practices, Rockville, MD: US Food and Drug Administration; January 2011. https://www.fda.gov/regulatory-information/search-fda-guidance-documents/process-validation-general-principles-and-practices.
23. International Organization for Standardization. ISO 3951: Sampling procedures for inspection by variables-specification for single sampling plans indexed by acceptable quality level (AQL) for lot-by-lot. 2013.
24. American National Standards Institute/American Society for Quality, ANSI/ASQ Z1.4-2003 (R2013). Sampling procedures and tables for inspection by attributes. Milwaukee, WI: American Society for Quality.
25. Ripple DC, DeRose PC. Primary determination of particle number concentration with light obscuration and dynamic imaging particle counters. J Res Natl Inst Stan. 2018;123. https://doi.org/10.6028/jres.123.002.
26. Cavicchi RE, King J, Ripple DC. Measurement of average aggregate density by sedimentation and brownian motion analysis. J Pharm Sci. 2018;107(5):1304-1312.
27. International Council for Harmonisation (ICH). Q7 Guideline. Good manufacturing practice for active pharmaceuticals ingredients. 2000.
28. USP. Particulate Matter in Injections (788). In: USP 23-NF 28. Rockville, MD: USP; May 1, 1995.
29. Large Volume Parenteral Task Force of the Health Industry Manufacturers Association. Final report: improved microscopic assay for the enumeration of particulate matter in parenteral solutions. Pharm Forum. 1993;19(3):5435-5456.
30. Barber TA, Pharmaceutical Particulate Matter: Analysis and Control. Buffalo Grove, IL: Interpharm Press; 1993.
