Light Obscuration Method for the Determination of Subvisible Particulate Matter
If you find any inaccurate information, please let us know by providing your feedback here

Tóm tắt nội dung
- 1. INTRODUCTION
- 2. PRINCIPLES OF OPERATION
- 3. INSTRUMENT STANDARDIZATION TESTS
- 4. SYSTEM SUITABILITY
- 5. TEST ENVIRONMENT
- 6. BLANK AND SAMPLE HANDLING
- 7. PARTICLE COUNTING ACCURACY (SYSTEM SUITABILITY)
- REFERENCES
This article is compiled based on the United States Pharmacopeia (USP) – 2025 Edition
Issued and maintained by the United States Pharmacopeial Convention (USP)
1 1. INTRODUCTION
Light obscuration (LO) is useful for an approximate particle range from 1 to 300 μm, depending on the instrument and configuration (see Measurement of Subvisible Particulate Matter in Therapeutic Protein Injections 〈1787〉 and Methods for the Determination of Subvisible Particulate Matter 〈1788〉). Certain solution formulations may not be easily analyzed by LO. The LO method may encounter problems with products that do not have the clarity and viscosity approximating that of water. Further, formulation characteristics such as color and high viscosity, or inherent formulation properties such as shear-induced changes, may generate erroneous LO data. Similarly, products that produce air or gas bubbles when drawn into the LO sensor, such as bicarbonate-buffered formulations, may generate erroneous data. For these product types, the membrane microscope (MM) method may be more appropriate.
LO is based on light blockage/light extinction on a photodiode detector induced by particles passing a flow cell illuminated by a laser beam. The degree of obscuration is converted into electronic pulses, which can be related back to the equivalent circular diameter of the particles, based on a calibration curve generated with polystyrene standard beads. Because of the nature of the detection and counting system, air bubbles and immiscible liquids may block sufficient light to be recorded along with the target suspended particles. These artifacts must be diminished through proper preparation techniques. Solutions with excessive immiscible liquids may not be amenable to LO analysis. A variety of suitable devices of this type are commercially available. It is the responsibility of those performing the test to ensure that the operating parameters of the instrumentation are appropriate for the required accuracy and precision of the test results, and that the artifacts and interferences inherent in certain products and with certain methods of preparation are eliminated or accommodated.
2 2. PRINCIPLES OF OPERATION
The apparatus is a liquid-borne particle counting system that uses a LO sensor with a suitable sample-feeding device to deliver controlled aliquots of sample for analysis. Suspended particles in the sample fluid flow between a light source and sensor to obscure the transmitted light by either scattering or absorbing light. The corresponding signal reduction correlates to the area of each particle. In other words, larger particles cause a larger reduction in transmitted light, and the extent of the reduction represents the projected area of the particle passing through. LO instruments report the equivalent circular diameter of a polystyrene (PS) microsphere that attenuates the light beam by the same magnitude as the particle in the test sample. Because of the nature of the detection and counting system, air bubbles and immiscible liquids may diffract or block sufficient light and be recorded as particles. These artifacts must be diminished through proper sample preparation. Solutions with excessive immiscible liquids may not be amenable to LO analysis.
LO instruments detect, size, and count particles that are opaque or have a refractive index that is significantly different from the surrounding liquid. This includes not only ordinary (extrinsic) dirt particles but also gels, immiscible liquid droplets such as silicone oil droplets, air bubbles, and refractive index anomalies such as Schlieren effects. Semitransparent particles allow some laser light to pass through the particle, potentially resulting in the assignment of a smaller than actual size. All of the considerations for quantification, calibration, etc., discussed in 〈 1788〉 , Verification of Compendial Procedures 〈1226〉 , Particulate Matter in Injections 〈788〉 , Subvisible Particulate Matter in Therapeutic Protein Injections 〈787〉, and 〈1787〉 apply here. When performing the LO test on new drug products that have not been tested using this method, orthogonal methods should be considered as well. Ideally, subvisible particle analysis should be included during product development such that product history can be used to inform analysis and data interpretation or the product's release and commercial use.
A variety of suitable LO devices are commercially available. It is the responsibility of those performing the test to ensure that 1) the operating parameters of the instrumentation are appropriate to the required accuracy and precision of the test result and 2) the artifacts and interferences inherent in certain products and with certain methods of preparation are eliminated or accommodated. Because LO does not distinguish between air bubbles and particles, sample handling is critical (see 〈1788〉 and 〈1787〉). Adequate training must be provided for individuals responsible for the technical performance of the test.
It is important to note that for pharmacopeial applications, the ultimate goal is that the particle counter can reproducibly size and count particles present in the material under investigation. The instruments available range from those systems where calibration and other components of standardization must be carried out by manual procedures to more sophisticated systems that incorporate hardware- and software-based functions for the standardization procedures. Thus, it is not possible to specify exact methods to be followed for standardization of the instrument, and it is necessary to emphasize the required result of a standardization procedure rather than a specific method for obtaining this result. This section is intended to emphasize the criteria that must be met by a system rather than specific methods to be used. It is the responsibility of the user to apply the various methods of standardization applicable to a specific instrument. Critical operational criteria include the following two considerations.
2.1 2.1 Sensor Concentration Limits
Use an instrument that has a concentration limit (the maximum number of particles per milliliter) identified by the manufacturer that is greater than the concentration of particles in the test specimen to be counted. The vendor-certified concentration limit for a sensor is specified as the count level at which the coincidence error caused by the simultaneous presence of two or more particles in the sensor view volume comprises less than 10% of the counts collected for 10-µm particles. The coincidence error at sizes below 10 μm also should be known or evaluated.
2.2 2.2 Sensor Dynamic Range
The dynamic range of the instrument used (range of sizes of particles that can be accurately sized and counted) must include the smallest particle size to be enumerated in the products.
3 3. INSTRUMENT STANDARDIZATION TESTS
Because different brands of instruments may be used in the test, the user is responsible for ensuring that the counter used is always operated according to the manufacturer's specific instructions. For LO, the instrument standardization tests described in this section are consistent with installation qualification (IQ) and operational qualification (OQ) principles described in Analytical Instrument Qualification 〈 1058〉.
The following discussion of instrument standardization emphasizes performance criteria rather than specific methods for calibrating or standardizing a given instrument system. A wide variety of approaches can be taken to achieve this, and the underlying principle and final results should be the focus. Appropriate instrument standardization (calibration and routine qualification) is essential to performance of the test according to requirements.
The following information for instrument calibration helps ensure that the sample volume accuracy, sample flow rate, particle size response curve, sensor resolution, and count accuracy are appropriate to the performance of the test. Routine performance qualification should be carried out prior to use of the instrument or with sufficient frequency to verify that the instrument provides accurate and consistent results within the manufacturer’s specifications and for the intended use. The following sections focus on the instruments most commonly in use. For those older instruments without built-in routines to define particle size directly or those that do not incorporate computer-based software routines, see Appendix.
3.1 3.1 Sample Volume Accuracy
Because the particle count from a sample aliquot varies directly with the volume of fluid sampled, it is important that the sampling accuracy is known to be within a certain range. To accomplish this, transfer a volume of particle-free water that is greater than the sample volume to a container and weigh the container. Using the sample feeding device, withdraw a volume that is appropriate for the specific sampler and equal to the volume to be run during testing, and again weigh the container. Determine the sample volume by subtracting the tare volume from the combined sample plus tare volumes. Verify that the value obtained for the sample volume is within 5% of the appropriate sample volume for the test. Alternatively, the sample volume may be determined using a suitable Class A graduated cylinder (see Volumetric Apparatus 〈31〉). [NOTE—Instruments of this type require a variable tare volume. This is the amount of sample withdrawn before counting. This volume may be determined for syringe-operated samplers by setting the sample volume to zero and initiating sampling so that the only volume of solution drawn is the tare. Subtract the tare volume from the total volume of solution drawn in the sampling cycle to determine the sample volume.]
The choice of syringe has a significant effect on both the volume accuracy required to provide small volumes, as noted in 〈 787〉, and the associated flow rate required.
3.2 3.2 Sample Flow Rate
Verify that the flow rate is within the manufacturer's specifications for the sensor used. This can be accomplished by using a calibrated stopwatch to measure the time required for the instrument to withdraw and count a specific sample volume (i.e., the time between beginning and end of the count cycle as denoted by instrument indicator lights or other means). Sensors can be operated accurately over a range of flow rates.
3.3 3.3 Diameter Calibration
Refer to 〈 1788〉 for general guidance on diameter calibration. Laser LO instruments should be calibrated using spherical PS particles with an approximate refractive index of 1.59. Diameter readings are sensitive to the particle refractive index in two cases: 1) particle diameters below approximately 5 µm and 2) particles of all diameters with a refractive index within approximately 0.2 of the refractive index of the liquid. In these cases, instrument calibration ensures that the LO instrument is functioning properly and gives reproducible results, but it does not ensure that the reported diameters match the actual physical size of the test particles. Prior to conducting the calibration procedure, it is recommended that a system suitability test be performed to determine the "as found" performance of the instrument.
Two options for conducting diameter calibration are the automated method and the electronic method. With the automated method, the calibration (size response) curve can be determined for the instrument–sensor system using validated software routines offered by instrument vendors. These routines may be included as part of the instrument software or may be used in conjunction with a microcomputer interfaced with the counter. The use of these automated methods is appropriate if the vendor supplies written certification that the software provides a response curve equivalent to that attained by the manual half-count method or the electronic method and if the automated calibration is validated as necessary by the user.
The electronic method uses a multichannel peak height analyzer to determine the center channel of the particle counter pulse response for each standard suspension. This peak voltage setting becomes the threshold used for calculation of the voltage response curve for the instrument. The standard suspensions used for the calibration are run in order, and median pulse voltages for each are determined. These thresholds are used to generate the size response curve manually or via software routines. The thresholds determined from the multichannel analyzer data are then transferred to the counter to complete the calibration. Instrument indications other than a direct voltage reading may be used to construct the response curve.
3.4 3.4 Sensor Size Resolution
The particle size resolution test determines the amount of peak broadening due to instrument response. Determine the resolution of the particle counter for 10-µm particles using the 10-µm calibrator spheres. The relative standard deviation of the size distribution of the standard particles used, as reported by the manufacturer, must be NMT 5%. Acceptable methods of determining particle size resolution are 1) an electronic method of measuring and sorting particle sensor voltage output with a multichannel analyzer or direct reporting of the particle size distribution and 2) automated methods. Refer to Appendix for details on the electronic method.
3.4.1 AUTOMATED METHODS
Software that allows for the automated determination of sensor resolution is available for some counters. This software may be included in the instrument or used in conjunction with a microcomputer interfaced with the counter. The use of these automated methods is appropriate if the vendor supplies written certification that the software provides a resolution determination equivalent to the electronic method and if the automated resolution determination is validated as necessary by the user. LO resolution can degrade due to contaminated flow-cell walls; routine checks of resolution are useful since the flow-cell wall cannot be inspected otherwise.
Perform a system suitability test upon completion of the instrument calibration to ensure that diameters are accurately reported and that the count accuracy is verified using any of the three methods described in 7. Particle Counting Accuracy (System Suitability).
3.5 3.5 Qualification Considerations
3.5.1 DIAMETER BIASED
For particles of nonspherical shape and low refractive index, the reported diameter may differ substantially from the actual diameter (1). The reported diameter of a particle is affected most by the following:
The refractive index of the particle
The orientation of nonspherical particles
The degree of particle elongation, especially for long fibers (2)
If the diameter is reported incorrectly, the particle size distribution will be affected and the particle concentration for affected size channels (bins) will be incorrect. Concentration errors are most prevalent for particles that have a low refractive index (e.g., protein aggregates).
3.5.2 OPALESCENCE
Particle detection may be hindered in samples that are highly opalescent. To assess the visibility of particles, spike microspheres of known diameter and concentration into a test sample, measure the microsphere diameter and concentration, and then compare to the diameter and concentration expected. The microsphere chosen for this analysis should have a refractive index similar to that of the particles of interest in the test sample (e.g., silica microspheres could be used to mimic lower-contrast protein aggregates; polystyrene could be used to mimic higher-contrast particles).
3.5.3 VISCOSITY
For some samples, especially highly concentrated biologics such as antibody therapeutics, the drug product can be highly viscous. This can complicate the measurement by affecting instrument performance as well as the amount of material actually sampled and measured by the instrument. This measurement process should be tested during method development. It might be necessary to dilute the sample in order to get reliable measurements. If so, the effect of dilution on the particle distribution obtained should be determined, and appropriate procedures should be used to minimize differences due to this sample handling.
4 4. SYSTEM SUITABILITY
First, measure the particle concentration of nominally particle-free water. The measured particle concentrations obtained must in all cases be sufficiently small as to be insignificant relative to any acceptance limits for the tests to be run. The actual background level obtained will be dependent on the size range, the instrument used, and the type of samples routinely run in the instrument. Records of past blank runs are useful to document the level of performance expected of particular instruments and to identify deviations from acceptable performance (or unacceptable levels of particles in the water used).
4.1 4.1 Mixing
For Reference Standards, such as the USP Particle Count Set RS (used for particle count accuracy, recovery studies, or calibration), homogenization of the mixture may be attained by agitating the preparation for 20 s and sonicating for NMT 30 s. Mixing of most product samples will require different handling than that for the standard. Please note that this sample handling is not appropriate for many samples themselves, especially for the biologics.
The instrument should be checked for the correct size and concentration readings using at least one size of PS microspheres; bead sizes from 5 to 15 µm are typical for this test. Size and concentration should agree within the combined uncertainty of the manufacturer’s specifications and the tolerances listed on the size and concentration standard. Bead concentration standards should have a concentration three times lower than the manufacturer’s stated upper concentration limit for 10% coincidence error. Size and concentration tests may be conducted with a single bead suspension, or size and concentration may be tested independently.
If reduced particle count is observed, instrument fouling is suspected. Back-flushing the sensor to remove the clog may be helpful, followed by reconfirming the count accuracy using larger PS microspheres (e.g., 25 µm). When flushing sensors to change samples or to clean the sensor, alternate liquid and air in the fluid line to achieve the best flush of the sensor.
Refer to 〈 1788〉, 11.1 Guidelines for the Use of Calibrator Spheres if the instrument fails a system suitability test. If failure of the standard is ruled out, then follow the manufacturer’s directions for thoroughly cleaning all fluid lines and the sensor head. The instrument is deemed suitable for use if it passes the system suitability tests after cleaning. Flush the system to remove traces of the particle standard prior to routine use.
5 5. TEST ENVIRONMENT
Refer to 〈 1788〉, 12. Test Environment and Preparation for general guidance.
6 6. BLANK AND SAMPLE HANDLING
Refer to 〈 1788〉, 12. Test Environment and Preparation for general guidance.
7 7. PARTICLE COUNTING ACCURACY (SYSTEM SUITABILITY)
Determine the particle counting accuracy of the instrument using Method 1 [for sensors requiring the moving window half-count (MWHC) method for calibration], Method 2 (for multichannel sensors), or Method 3 for any instrument (manual comparison to MM method). Prepare the standard as described in 6 . Blank and Sample Handling, including continuous stirring throughout the analysis. Perform five counts on 5- mL volumes of the suspension using the particle counter's 10-µm size threshold. Obtain the mean cumulative particle count per milliliter.
Note that the three methods in this section verify particle counts. Only Method 1 verifies particle size as well as the count for MWHC instruments. Method 2 and Method 3 verify counts (>10 μm) but not size for instruments with fewer than 15 size channels, which means the instrument size accuracy can be off by more than 10% and still provide the correct counts (>10 µm) when using these two methods.
Automated instruments with 512 or more size-channels (bins) and validated software routines provide accurate mean size and concentration for each standard peak as well as other statistical parameters for each peak. The user needs to understand the limits and capabilities of the instrument being used and proceed accordingly.
7.1 7.1 Method 1 (Manual Method for MWHC Instruments)
See Appendix.
7.2 7.2 Method 2 (Multichannel Instruments)
7.2.1 PROCEDURE
Use one of three standards: 1) USP Particle Count Set RS (a dilution may be used if deemed necessary); 2) a commercial preparation of standard calibrator spheres with a nominal diameter of 10–30 µm, certified by the manufacturer; or 3) a laboratory-prepared suspension of standard calibrator spheres with a nominal diameter of 10–30 µm. The use of non-USP standards for options 2 or 3 is acceptable when they are compliant with USP standardization criteria: five successive counts are NMT ±10% of the stated count.
Stir continuously throughout the analysis and perform five counts on 5-mL volumes of the suspension using the particle counter's 10-µm size threshold. Stirring should be sufficiently thorough that the set of five counts does not show an obvious trend. Obtain the mean cumulative particle count per milliliter. Note that multichannel instruments provide a mean size and other statistical information as well as the particle counts within the size range selected by the user, i.e., the region that contains the peak.
7.2.2 INTERPRETATION
The instrument meets the requirements for 7. Particle Counting Accuracy (System Suitability) if the count obtained at ≥10 µm conforms to the values obtained for the USP Particle Count Set RS, or the expected particle number if other acceptable standards were used. If the instrument does not meet the requirements, repeat the procedure. If the results of the second test are within the limits given above, the instrument meets the requirements of the test for 7. Particle Counting Accuracy (System Suitability). If the system does not meet the requirements of the test on the second attempt, identify and correct the source of the failures and retest the instrument.
7.3 7.3 Method 3 (Alternate Manual Method)
7.3.1 PROCEDURE
Prepare a suspension of standard calibrator spheres with a nominal diameter of 10–30 µm that contains 50–200 particles/mL, and determine the particle concentration as described in Membrane Microscope Method for the Determination of Subvisible Particulate Matter 〈 1788.2〉. Stir continuously throughout the analysis and perform five counts on 5-mL volumes of the suspension using the particle counter's 10-µm size threshold. Stirring should be sufficiently thorough that the set of five counts does not show an obvious trend. Obtain the mean cumulative particle count per milliliter. This mean count should be within 20% of the count per milliliter for the suspension.
Change to read:
7.3.2 APPENDIX
Instrument Standardization Tests
These sections describe the development and use of methods to accommodate the few remaining older LO instruments still in use and for instrument manufacturers to refer to for development and verification of automated methods. In modern instruments, these methods or their equivalents have been incorporated into instrument software, and users will generally not need to execute the tests as described below.
Diameter Calibration Methods
7.3.3 MANUAL METHOD FOR DEVELOPING THE CALIBRATION CURVE
In this method, the diameter indications of an LO instrument are obtained by finding the LO instrument voltage corresponding to the midpoint of the particle size distribution (PSD) for nominally monodisperse PS spheres of known size. Refer to 3.3 Diameter Calibration, which describes the requirements for standards to be utilized in the calibration. When using the manual method, ensure that the total number of spheres counted is within the sensor's concentration limit. Prepare suspensions of the calibrator spheres in water at a concentration of 1000–5000 particles/mL, and determine the channel setting that corresponds to the highest count setting for the sphere distribution. This is determined by using the setting for the highest count threshold to split the distribution into two bins containing equal numbers of particles, with the instrument set in the differential count mode (MWHC). Use only the central portion of the distribution in this calculation to avoid including asymmetrical portions of the peak.
The portion of the distribution that must be divided equally is the count window. The window is bound by threshold settings that will define a threshold voltage window of ±20% around the mean diameter of the test spheres. The window is intended to include all single spheres, taking into account the standard deviation of the spheres and the sensor resolution while excluding noise and aggregates of spheres. The value of 20% was chosen on the basis of the worst-case sensor resolution of 10% and the worst-case standard deviation of the spheres of 10%. Because the thresholds are proportional to the cross-sectional area of the spheres (and all particles) rather than the diameter, the lower and upper voltage settings are determined by the following equations:
VL = 0.64VS
in which VL is the lower voltage setting and VS is the voltage at the peak center, and
VU = 1.44 VS
in which VU is the upper voltage setting. Once the center peak thresholds are determined, use these thresholds for the standards to create a regression of log voltage versus log particle size from which the instrument settings for the 10- and 25-µm sizes can be determined.
7.3.4 SENSOR SIZE-RESOLUTION METHODS
The test for sensor size resolution calculates the standard deviation of reported sizes from the measured PSD for monodisperse PS spheres. The instrument resolution is obtained by correcting the observed standard deviation of the reported sizes for the standard deviation of the PS sphere size standard, as reported by the manufacturer.
Manual method: The manual method applies to instruments with size bins that have adjustable voltage thresholds. When using the manual method, adjust the particle counter to operate in the cumulative mode or total count mode. Refer to the calibration curve obtained earlier, and determine the threshold voltage for the 10-µm spheres. Adjust three channels of the counter to be used in the calibration procedure as follows:
Channel 1—set for 90% of the threshold voltage
Channel 2—set for 100% of the threshold voltage
Channel 3—set for 110% of the threshold voltage
Draw a sample through the sensor, observing the count in Channel 2. When the particle count in that channel has reached approximately 1000, stop counting and observe the counts in Channels 1 and 3. Check to see if the Channel 1 count and Channel 3 count are 1.68 ± 10% and 0.32 ± 10%, respectively, of the count in Channel 2. If not, adjust the Channel 1 and Channel 3 thresholds to meet these criteria. When these criteria have been satisfied, draw a sample of suspension through the counter until the counts in Channel 2 have reached approximately 10,000, or until an appropriate volume (e.g., 10 mL) of the sphere suspension has been counted. Verify that the Channel 1 and Channel 3 counts are 1.68 ± 3% and 0.32 ± 3%, respectively, of the count in Channel 2. Record the particle size for the thresholds just determined for Channels 1, 2, and 3. Subtract the particle size for Channel 2 from the size for Channel 3. Subtract the particle size for Channel 1 from the size for Channel 2. The values so determined are the observed standard deviations on the positive side and negative side of the mean count for the 10-µm standard. One commonly used method for calculating the percentage resolution of the sensor is the following:
% Resolution = (100/d) × [(sobserved)2 − (sstandard)2]1/2
in which d is the diameter of the spheres, in μm, as specified by the supplier; sobserved is the highest observed standard deviation determined for the sphere standard; sstandard is the supplier’s reported standard deviation for the spheres. The resolution is NMT 10%.
Electronic method: Either record the voltage output distribution of the particle sensor using a multichannel analyzer while sampling a suspension of the 10-µm particle size standard or record the reported particle size distribution of an LO system that reports counts within adjustable diameter bins directly. (Other sizes ranging from 5 to 25 µm may be used provided the resolution is initially compared to the results for 10-µm microspheres and the subsequent measurements all use the same-size microsphere.) Particle size bins must each have a diameter range ±0.5 of the standard deviation of the main singlet bead peak, and the number of bins used for determination of the standard deviation must cover a minimum size range from (dobserved−2sobserved) to (dobserved+ 2sobserved). From the recorded particle size distribution, first identify the range of size bins that bracket the main singlet bead peak. From these identified bins, calculate the standard deviation (sobserved) of the readings:
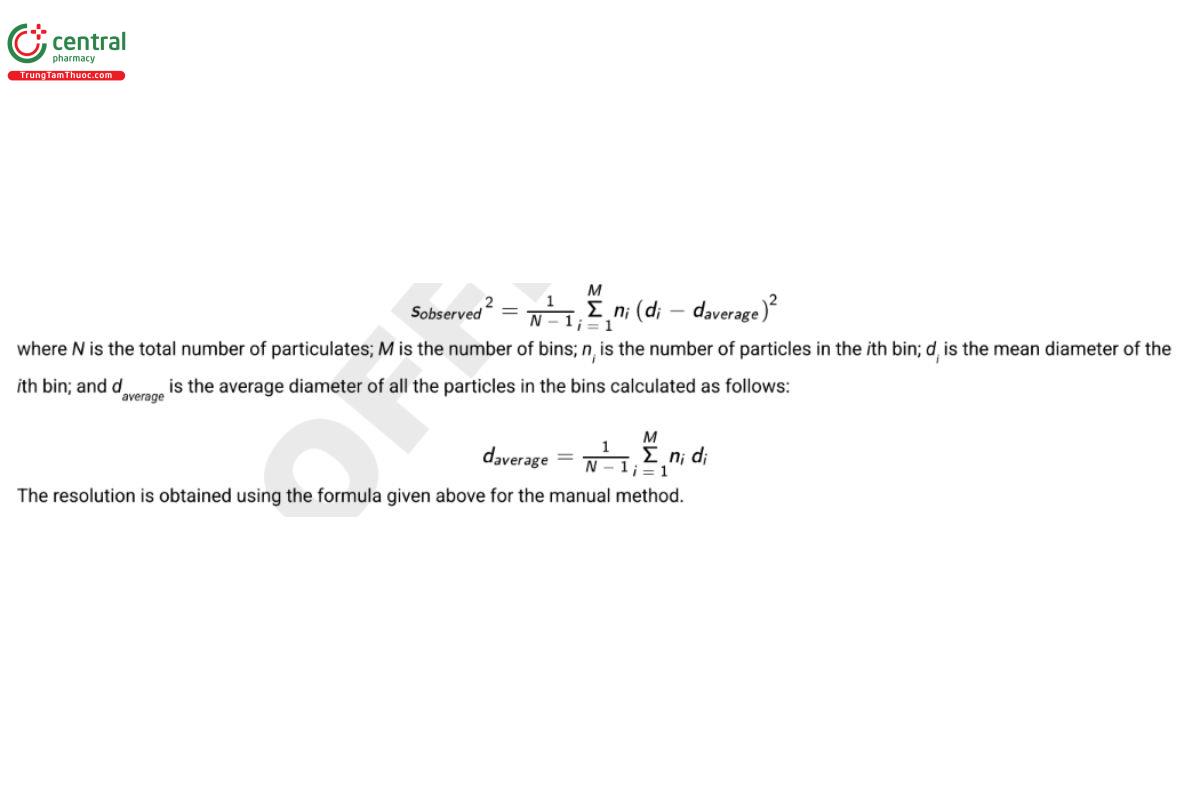
7.4 Particle Count Accuracy Manual Method Test for MWHC Instruments
7.4.1 OVERVIEW
The USP Particle Count Set RS contains PS spheres of approximately 15 µm in diameter. Counting with a size threshold ≥10 µm gives a measure of all the PS spheres. On setting the threshold to ≥15 µm, however, only approximately half the spheres will be counted.
Comparison of the counts at these two size thresholds with values on the USP certificate provides a test of count accuracy. The test is also sensitive to size accuracy at 15 µm, since small errors in size will translate into large errors in count at the midpoint of the particle size (ERR 1-Oct-2021) distribution.
7.4.2 PROCEDURE
Prepare the suspension and blank using the USP Particle Count Set RS. With the instrument set to count in the cumulative (total) mode, collect counts at settings of ≥10 µm and ≥15 µm. Withdraw three consecutive volumes directly from the container. Historically, these have been volumes of NLT 5 mL each, due to instrument limitations and the desire to maximize sample volume. However, where desired, volumes that meet the standardization criteria and address the sensitivities of the formulation may be utilized. Obtain the particle counts and discard the data from the first portion. Complete the procedure within 5 min. Repeat the procedure using the suspension in place of the blank. From the averages of the counts resulting from the analysis of the two portions of the suspension at ≥10 µm and from the analysis of the two portions of the blank at ≥10 µm, calculate the number of particles in each milliliter:
(PS − PB)/V
in which PS is the average particle count obtained from the suspension; PB is the average particle count obtained from the blank; and V is the average volume, in mL, of the four portions tested. Repeat the calculations using the results obtained at the setting of NLT 15 µm.
7.4.3 INTERPRETATION
The MWHC instrument meets the requirements for 7. Particle Counting Accuracy (System Suitability) if both the count obtained at ≥10 µm and the ratio of the counts obtained at ≥10 µm to those obtained at ≥15 µm conform to the values that accompany the USP Particle Count Set RS. If the instrument does not meet the requirements for 7. Particle Counting Accuracy (System Suitability), and adequate test volumes remain, repeat the procedure; if insufficient volumes remain, prepare new a suspension and blank and then repeat the procedure. If the results of the second test are within the limits given above, the instrument meets the requirements of the test for 7. Particle Counting Accuracy (System Suitability). On the second attempt, if the system does not meet the requirements of the test, determine and correct the source of the failures and retest the instrument. When using this ratio method, it is recommended to check the instrument size accuracy at both 10 µm and 15 µm prior to measurement of the count ratio, since a size error at 15 µm can translate into a large count error.
8 REFERENCES
1. Ripple DC, Hu Z. Correcting the relative bias of light obscuration and flow imaging particle counters. Pharm Res. 2016;33:653–72.
2. Cavicchi RE, Carrier MJ, Cohen JB, Boger S, Mongomery CB, Hu z, et al. Particle shape effects on subvisible particle sizing measurements. J. Pharm. Sci. 2015;104:971–987.
