Insulin Assays
If you find any inaccurate information, please let us know by providing your feedback here


Tóm tắt nội dung
This article is compiled based on the United States Pharmacopeia (USP) – 2025 Edition
Issued and maintained by the United States Pharmacopeial Convention (USP)
DOWNLOAD PDF HERE
1 INTRODUCTION
The most prominent manifestation of Insulin activity, an abrupt decrease in blood glucose, was the basis for biologic assay from the time of its first clinical use. The bio (USP 1-Dec-2020) assay, although relatively cumbersome, has the great merit of accurately reflecting the effect on the diabetic patient. The advent of practical yet sophisticated physicochemical methods (e.g., liquid chromatography) to measure insulin potency quantitatively has resulted in a more accurate and precise compendial test for insulin and insulin products.
However, the bioidentity of insulin and insulin products cannot be assessed by these methods. Thus, a bioidentity test (USP 1-Dec-2020) is called for in the appropriate monographs.
Two options are provided: The Rabbit Blood Sugar Method can be used for any compendial insulin or insulin analog. The In Vitro Cell-Based Bioidentity Test can be used for Insulin glargine and Insulin lispro. (USP 1-Dec-2020) The Rabbit Blood Sugar Method-Quantitative is used to determine the potency of Insulin Reference Standards, for the validation of the stability of new insulin preparations, and to determine the specific activities of insulin analogs.
2 ASSAY
Change to read:
2.1 RABBIT BLOOD SUGAR METHOD QUANTITATIVE
Diluent: Prepare an aqueous solution containing 0.1%-0.25% (w/v) of either cresol or phenol, 1.4%-1.8% (w/v) of Glycerin, and sufficient hydrochloric acid to produce a pH between 2.5 and 3.5, unless otherwise directed in the individual monograph.
Standard stock solution: Prepare a solution containing 40 USP Insulin Units/mL of the USP Insulin Reference Standard of the appropriate species in Diluent and having a pH between 2.5 and 3.5, unless otherwise directed in the individual monograph. Store in a refrigerator, (USP 1-Dec-2020) protected from freezing, and use within 6 months.
Standard solution 1: Dilute a portion of the Standard stock solution with Diluent to contain 1.0 USP Insulin Unit/mL.
Standard solution 2: Dilute a portion of the Standard stock solution with Diluent to contain 2.0 USP Insulin Units/mL.
Sample stock solution: Prepare as directed in the Standard stock solution, except to use a suitable quantity of the preparation under test in place of the USP Insulin Reference Standard of the appropriate species. The Sample stock solution contains about 40 USP Insulin Units/mL.
Sample solution 1: Dilute a portion of the Sample stock solution with Diluent to make a dilution of the preparation under test. On the basis of the assumed potency, it is expected to contain 1.0 USP Insulin Unit/mL. In the case of neutral insulin injection, adjust to a pH of 2.5-3.5 before making the dilution.
Sample solution 2: Dilute a portion of the Sample stock solution with Diluent to make a dilution of the preparation under test. On the basis of the assumed potency, it is expected to contain 2.0 USP Insulin Units/mL. In the case of neutral insulin injection, adjust to a pH of 2.5-3.5 before making the dilution.
Doses of the solutions to be injected: Select, on the basis of trial or experience, the dose of the dilutions to be injected, the volume of which usually will be between 0.30 and 0.50 mL. For each animal, the volume of the Standard solution is the same as that of the Sample solution.
Preparation of animal: Select suitable, healthy rabbits, each weighing NLT 1.8 kg. Keep the rabbits in the laboratory for NLT 1 week before use in the assay, maintaining them on an adequate uniform diet, with water available at all times.
Analysis: Divide the rabbits into four equal groups of preferably NLT 6 rabbits each. On the preceding day, approximately 20 h before performing the assay, provide each rabbit with an amount of food that will be consumed within 6 h. Follow the same feeding schedule before each test day. During the assay, withhold all food until after the final blood specimen is taken. Handle the rabbits with care to avoid undue excitement, and inject subcutaneously the doses indicated in the following design (see Table 1), the second injection being made on the day after the first injection, or NMT 1 week later. The time between the first and second injections is the same for all rabbits.
Table 1
| Group | First Injection | Second Injection |
| 1 | Standard solution 2 | Sample solution 1 |
| 2 | Standard solution 1 | Sample solution 2 |
| 3 | Sample solution 2 | Standard solution 1 |
| 4 | Sample solution 1 | Standard solution 2 |
Blood samples: At 1 h ± 5 min and 2.5 h ± 5 min after the time of each (USP 1-Dec-2020) injection, obtain from each rabbit a suitable blood specimen from a marginal ear vein. Blood can also be collected effectively from the central auricular artery.
Dextrose determination: Determine the dextrose content of the blood specimens by a suitable procedure that is adapted to automated analysis. The following procedure may be used.
Anticoagulant solution: Dissolve 1 g of edetate sodium and 200 mg of sodium fluoride in 1 L of water, and mix.
Dextrose standard preparations: Transfer known concentrations of USP Dextrose RS to suitable vessels, and dilute quantitatively and stepwise with Anticoagulant solution (1:9) to obtain a range of Dextrose standard preparations containing 20-100 mg/100 mL, having known concentrations similar to the concentrations in the rabbit blood samples.
Sample preparations: Pipet into separate, suitable vessels 0.1 mL of each Blood sample and 0.9 mL of Anticoagulant solution.
Analysis: Subject the Sample preparations to dialysis across a semipermeable membrane for a sufficient time so that the dextrose passes through the membrane into a saline TS solution containing Glucose oxidase, horseradish Peroxidase, 3-methyl-2-benzothiazolinone hydrazone hydrochloride TS, and N,N-dimethylaniline. The absorbances of the Sample preparations are determined at 600 nm in a recording colorimeter. The absorbances of the Dextrose standard preparations are similarly determined at the start and the end of each run.
Calculation: Calculate the response of each rabbit to each injection from the sum of the two blood sugar values, and subtract its response, disregarding the chronological order in which the responses were observed, to obtain the individual differences, y, as shown in Table 2.
When the data for one or more rabbits are missing in an assay, do not use the confidence interval formulas given here, but seek statistical help. The data can still be analyzed with proper analysis of variance.
When the number of rabbits, f, carried through the assay is the same in each group, total the y's in each group and compute:
Ta = T1 + T2 + T3 - T4
and Tb = T1 + T2 + T3 + T4
The logarithm of the relative potency of the test dilutions is M = 0.301T/T. The potency of the injection in USP Units/mg equals the antilog (log R + M'), where:
R= Vs/Vu
Vs= number of USP Units/mL of insulin in the Standard solution
Vu = number of mg/mL of insulin in the corresponding Sample solution
Table 2
| Group | Differences | Individual Response (y) | Total Response (T) | Standard Deviation of Differences (S) |
| 1 | Standard solution 2 − Sample solution 1 | y1 | T1 | S11 |
| 2 | Sample solution 2 − Standard solution 1 | y2 | T2 | S2 |
| 3 | Sample solution 2 − Standard solution 1 | y3 | T3 | S3 |
| Sample solution 2 − Standard solution 1 | y4 | T4 | S4 |
Determine the 95% confidence interval for the log-relative potency using Fieller's Theorem for Determining the Confidence Interval for a Ratio as shown below. (USP 1-Dec-2020) If the confidence interval width (U-L) (USP 1-Dec-2020) is more than 0.082, which corresponds at P = 0.95 to confidence limits of about ±10% of the computed potency, repeat the assay until the combined data of the two or more assays, redetermined as described in Design and Analysis of Biological Assays (111), Combination of Independent Assays. meet this acceptable limit.
Change to read:
2.2 (USP 1-Dec-2020) Fieller's Theorem for Determining the Confidence Interval for a Ratio
This version of Fieller's Theorem is for the case where the numerator and denominator are uncorrelated. The equation assumes that the numerator and denominator are normally distributed and that the groups of rabbits are of equal sizes.
Then, the 95% confidence interval (L: lower, U: upper) (USP 1-Dec-2020) for the ratio is:
.jpg)
where f (degrees of freedom in the standard errors) = 4(k - 1) , where k is the number of gabbits in a group, t is the upper 97.5 percentile of the t-distribution with f degrees of freedom, and
.jpg)
If g ≥ 1 the denominator is not significantly different from 0 and the does not work.
.jpg)
Change to read:
2.3 IN VIVO (USP 1-Dec-2020) BIOIDENTITY TEST
Proceed as directed in Rabbit Blood Sugar Method-Quantitative with the following modifications.
Procedure: Divide the rabbits into four equal groups of 2 rabbits each.
Calculation: Proceed as directed for Calculation in Rabbit Blood Sugar Method-Quantitative, but do not determine the confidence interval of the log-relative potency, M'.
Interpretation: If the potency value obtained is NLT 15 USP Units/mg, then the In Vivo (USP 1-Dec-2020) Bioidentity Test requirement is met. If the potency value is less than 15 USP Units/mg, then repeat the test using 8 more rabbits. If the average potency of the two sets of tests is NLT 15 USP Units/mg, then the requirement of the test is met.
Add the following:
2.4 In Vitro Cell-Based Bioidentity Test for Insulin Glargine and Insulin Lispro
Minimal medium: Ham's F-12 Nutrient Mixture containing 1 mM L-alanyl-L-glutamine1
Growth medium: 90% (v / v) Ham's F-12 Nutrient Mixture with 1 mM L-alanyl-glutamine, 10% (v/v) fetal bovine serum (FBS)2 and 0.03% (w / v) hygromycin B
D-PBS solution: Dulbecco's phosphate-buffered saline without calcium and magnesium3 containing 0.2 g/L of potassium chloride, 0.2 g/L of monobasic potassium phosphate, 8 g/L of sodium chloride, and 2.16 g/L of dibasic sodium phosphate.
Fixing solution: Prepare 3.7% (v/v) formaldehyde solution by diluting a commercially available 37% (w/v) formaldehyde solution with D-PBS solution. Prepare freshly before use.
Permeabilization solution: 0.1% (v/v) Triton X-100 in D-PBS solution
Washing solution: 0.1% (v/v) polysorbate 20 in D-PBS solution
Blocking buffer: 2% (w/v) bovine serum Albumin (BSA)4 in D-PBS solution. [NOTE-Filtration of solution can be helpful to remove particles.]
Blocking buffer for primary antibody: 0.1% (v/v) polysorbate 20 in Blocking buffer
Primary antibody solution: Dilute an anti-phosphotyrosine antibody5 recognizing phosphotyrosines of insulin receptors in Blocking buffer for primary antibody. [NOTE-For example, dilute the anti-phosphotyrosine mouse monoclonal antibody in Blocking buffer for primary antibody at 1:2000 when the antibody is at a concentration of 1 mg/mL. Use within 15 min after preparation.]
Blocking buffer for secondary antibody: 0.2% (v/v) polysorbate 20 in Blocking buffer
Secondary antibody solution: Dilute a suitable secondary antibody conjugated with a suitable fluorescent dye6, a fluorescent dye for cell staining7, and/or a suitable fluorescent dye for DNA stainin8 in Blocking buffer for secondary antibody. Protect the solution from light. [NOTE-See example on preparing a Secondary antibody solution.9]
Cell culture preparation: Culture CHO INSR 1284 cells10 in Growth medium at 37° and 5% carbon dioxide (CO₂) atmosphere in a humidified incubator. Cells should be transferred when the cultures are approximately 70%-95% confluent. For cell transfer, remove the flasks from the incubator and discard the media. Rinse the cells with D-PBS solution. Add an appropriate amount of Accutase11 to the cells and place in an incubator for about 5 min at 37°. Tap repeatedly on the flask in order to remove all cells from the flask bottom. Add an appropriate amount of Growth medium to stop the Accutase activity. Determine cell concentration and viability. Calculate the desired amount of cells for seeding depending on planned cultivation days. Cells are transferred into a T75 cm² flask with approximately 18 mL of Growth medium at 0.25 x 10⁵ to 9 x 10⁵ cells per flask or a T175 cm² flask with approximately 45 mL of Growth medium at 0.1 x 10⁶ to 2 x 10⁶ cells per flask.
2.4.1 Preparation of cells for analysis
Plates: Sterile 96-well, clear bottom, black12
2.4.2 System suitability requirements for the cells
Viability: NLT 85%
Average % of cell aggregates: NMT 15% of cell clumps. [NOTE-The clump is defined as a cluster containing more than 3 cells.]
For bioidentity test, a total of two plates of cells are needed to assay two independent dilutions of the Standard solution and the Sample solution. The maximal number of cell passages to be used is determined individually. Following the procedure described in Cell culture preparation, prepare an appropriate volume of cell solution at 0.5 x 10⁵ to 1 x 10⁵ viable cells/mL in Growth medium (see Table 3 for examples of seeding densities).
Table 3
| Initial Cell Concentration (cells/mL) | Number of Cells Seeded per Well | Time Needed for Growth Prior to Analysis (days) |
| 100,000 | 20,000 ± 20% | 2 |
| 70,000 | 14,000 ± 20% | 3 |
| 50,000 | 10,000 ± 20% | 4 |
To the sterile plates add 0.2 mL of cell solution per well under aseptic conditions. Mix the cell solution frequently during dispensing to prevent cells from settling and to ensure consistent density throughout the plate. Cover the plates. Let the plates seeded with cells stand at room temperature for 30 min before transferring them into an incubator. Arrange the plates side by side, and do not stack up the plates. Incubate plates at 37° with 5% carbon dioxide (CO₂) for the indicated time as shown in Table 3. Verify even growth and 90% or higher confluency via microscope before Analysis. Following the incubation, remove media from the cells and wash each well with 200 µL of sterile D-PBS solution. Add 160 µL of sterile Minimal medium to each well. Incubate plates for 3-5 h at 37° with 5% carbon dioxide (CO₂). This last step is for cell media starvation prior to Analysis.
2.4.3 Preparation of solutions for insulin glargine and insulin lispro
Up to three different insulin samples can be tested in one assay. For bioidentity test, independently prepare Standard solutions and Sample solutions in duplicate that are assayed in two separate plates to obtain two intermediate potency results per sample.
[NOTE-All described dilutions except for stock solutions are to be carried out just prior to their application to the cells. For each black plate seeded with cells as described in Preparation of cells for analysis, one separate 96-well polypropylene plate can be used for preparation of the serial dilutions from one of the Standard solution or Sample solution duplicates.]
Preparation of the Standard solution and Sample solution and delivery to the cells must occur within 15 min when using plasticware.
2.4.4 Insulin glargine
Standard stock solution: 17 USP Insulin Glargine Units/mL of USP Insulin Glargine RS in 0.01 N hydrochloric acid
Standard solutions: 0.34 USP Insulin Glargine Units/mL prepared by diluting the Standard stock solution with D-PBS solution. Prepare in duplicate.
Sample solutions: 0.34 USP Insulin Glargine Units/mL of insulin glargine in D-PBS solution. Prepare in duplicate.
Diluted standard solutions and sample solutions: For each assay plate, prepare three separate dilution sets from one of the Standard solution and Sample solution preparations. The range of the concentrations of insulin glargine solutions to be added to the cells needs
to be determined during method verification. Successful testing was demonstrated for a range of 340 x 10-3 to 0.16 x 10⁻³ USP Insulin Glargine Units/mL. The dilution can be prepared as follows. Add 200 µL of D-PBS solution into each well of a 96-well polypropylene plate, except those wells in row A. Next, add 300 µL of Standard solution into wells A1, A5, and A9 of the dilution plate. Add 300 µL of the first Sample solution into wells A2, A6, and A10; the second Sample solution into wells A3, A7, and A11; the third Sample solution into wells A4, A8, and A12. Perform simultaneously serial three-fold dilutions on the plate by transferring 100 µL of solution from the first row (A1-A12) to the second row, and mix three times. Then transfer 100 µL of solution from the second row to the third row, and mix three times. Repeat this procedure across the whole plate up to row H. Repeat the above for the replicate preparation.
2.4.5 Insulin lispro
Dilution buffer: 0.1% (w/v) BSA4 in D-PBS solution. Prepare freshly before use.
Standard stock solution: 10 USP Insulin Lispro Units/mL of USP Insulin Lispro RS in 0.01 N hydrochloric acid
Standard solutions: 0.3 USP Insulin Lispro Units/mL in duplicate prepared by diluting the Standard stock solution with Dilution buffer
Sample solutions: 0.3 USP Insulin Lispro Units/mL of insulin lispro in Dilution buffer. Prepare in duplicate.
Diluted standard solutions and sample solutions: For each assay plate, prepare three separate dilution sets from one of the Standard solution and Sample solution preparations. The range of the concentrations of insulin lispro solutions to be added to the cells needs to be determined during method verification. Successful testing was demonstrated for a range of 300 * 10 ^ - 3 to 0.004 * 10 ^ - 3 USP Insulin Lispro Units/mL. The dilution can be prepared as follows. Dispense 300 µL of Dilution buffer into each well of a 96-well polypropylene plate, except those wells in rows A, B, and C. Add 180 µL of Dilution buffer into the wells of row B and C. Next, add 300 µL of Standard solution into wells A1, A5, and A9. Add 300 µL of the first Sample solution into wells A2, A6, and A10; the second Sample solution into wells A3, A7, and A11; the third Sample solution into wells A4, A8, and A12. Perform simultaneously serial dilutions on the plate by transferring 120 µL of solution from the first row (A1-A12) to the second row, and mix three times. Then transfer 60 µL of solution from the second row to the third row, and mix three times. Next transfer 60 µl of solution from the third row to the fourth row, mix three times, and repeat this procedure across the whole plate up to row H. Repeat the above for the replicate preparation.
Analysis: All solutions are added by pipetting them into the plate wells carefully without touching the bottom. Following cell starvation, add 40 µL per well of each Diluted standard solution or Diluted sample solution into appropriate wells of the plate. Since each well has contained 160 µL of Minimal medium, the Diluted standard solution and Diluted sample solution are further diluted by a factor of 5.
[NOTE-See Table 4 for an example of the plate layout, which can be changed column by column for randomization purposes. See Design and Development of Biological Assays 1032. 5. Stages in the Bioassay Development Process. 5.1 Design: Assay Layout, Blocking, and Randomization for helpful information on randomization of samples and plate layout.]
Table 4
| 1 | 2 | 3 | 4 | 5 | 6 | 7 | 8 | 9 | 10 | 11 | 12 | |
A | St,#1 | S1,#1 | S2,#1 | S3,#1 | St,#1 | S1,#1 | S2,#1 | S3,#1 | St,#1 | S1,#1 | S2,#1 | S3,#1 |
| B | St,#2 | S1,#2 | S2,#2 | S3,#2 | St,#2 | S1,#2 | S2,#2 | S3,#2 | St,#2 | S1,#2 | S2,#2 | S3,#2 |
| C | St,#3 | S1,#3 | S2,#3 | S3,#3 | St,#3 | S1,#3 | S2,#3 | S3,#3 | St,#3 | S1,#3 | S2,#3 | S3,#3 |
| D | St,#4 | S1,#4 | S2,#4 | S3,#4 | St,#4 | S1,#4 | S2,#4 | S3,#4 | St,#4 | S1,#4 | S2,#4 | S3,#4 |
| E | St,#5 | S1,#5 | S2,#5 | S3,#5 | St,#5 | S1,#5 | S2,#5 | S3,#5 | St,#5 | S1,#5 | S2,#5 | S3,#5 |
| F | St,#6 | S1,#6 | S2,#6 | S3,#6 | St,#6 | S1,#6 | S2,#6 | S3,#6 | St,#6 | S1,#6 | S2,#6 | S3,#6 |
| G | St,#7 | S1,#7 | S2,#7 | S3,#7 | St,#7 | S1,#7 | S2,#7 | S3,#7 | St,#7 | S1,#7 | S2,#7 | S3,#7 |
| H | St,#8 (BG) | S1,#8 | S2,#8 | S3,#8 | St,#8 (BG) | S1,#8 | S2,#8 | S3,#8 | St,#8 (BG) | S1,#8 | S2,#8 | S3,#8 |
Legend: St,#1–#8 = Diluted standard solutions prepared from the dilution series of Standard solutions. S1, S2, S3, #1–#8 = Diluted sample solutions prepared from the dilution series of Sample solutions of insulin samples 1, 2, and 3. BG = Background; Diluted standard solutions at the lowest concentration serve as background. | ||||||||||||
[NOTE-All the steps below are performed at room temperature, unless otherwise specified.]
Incubate the plates at 37" with 5% carbon dioxide (CO₂) for 20 min. Discard the media and replace with 150 µL of freshly prepared
Fixing solution per well. Incubate the plates for 20 min with constant gentle shaking. Discard the Fixing solution, and add 200 µL of Permeabilization solution to each well. Incubate the plates for 10 min with constant gentle shaking. Repeat the permeabilization step once. Discard the Permeabilization solution and add 300 µL of Blocking buffer to each well. Cover the plates. Incubate the plates at 2*-8" overnight without shaking.
Remove Blocking buffer and add 50 µL of freshly prepared Primary antibody solution to each well. Cover the plates. Incubate the plates for about 2 h with constant gentle shaking. Alternatively, before removing the Blocking buffer, incubate the plates at room temperature for 1 h with constant gentle shaking. Then remove the Blocking buffer, add freshly prepared Primary antibody solution, and cover the plates. Incubate at 2-8° overnight without shaking.
Discard the Primary antibody solution, wash each well 5 times using 200 µL of Washing solution per well each time. Perform each wash step under constant gentle shaking for about 5 min. Apply 50 µL of freshly prepared Secondary antibody solution to each well. Incubate the plates protected from light (use black lids) for about 1 h with constant gentle shaking. Discard the Secondary antibody solution. Wash each well 5 times using 200 µL of Washing solution per well each time. Perform each wash step under constant gentle shaking for about 5 min. Add 200 µL of Washing solution per well and leave the solution in until measurement. Protect the plates from light. [NOTE-The plates containing the Washing solution can be stored at 2"-8" for a maximum of 24 h and protected from light]
Read the plate in a suitable microplate reader or scanner with appropriate excitation and emission wavelengths.
2.4.6 Instrumental conditions
Mode: Fluorescence13
Analytical wavelengths: Appropriate excitation and emission wavelengths based on the fluorescent dyes used. Excitation wavelength for the secondary antibody signal needs to differ from the wavelength of the cell and/or DNA stain in order to enable parallel readout, for example, using about 800 nm to detect the secondary antibody and about 700 nm to detect DRAQ5" DNA Dye and Sapphire700".
Calculations: For each well of each assay plate, normalize (for number of cells per well) the assay signals detected from the secondary antibody that is bound to the primary antibody with the signals from the fluorescent dye for the cell staining and/or DNA fluorescent dye, which represent the total number of cells present for that well. The processed signal is derived from the normalized signal that is subtracted by the background signal. The background signal is the average of the normalized signals detected by the Diluted standard solution at the lowest concentration. If necessary, it can be multiplied with a factor smaller than 1.0 in order to avoid negative values at the lowest concentration after background subtraction.
Generate a dose-response curve by plotting the processed signal responses from each set of Diluted standard solutions or Diluted sample solutions from one assay plate against their concentrations on a logarithmic scale using a four parameter logistic (4-PL) constrained model. Therefore, three individual curves representing triplicate sets of Diluted standard solutions or Diluted sample solutions from each assay plate are generated. Determine the individual EC value for the Standard solution or Sample solution from each of the curves of each assay plate.
[NOTE-The necessity of the responses to be weighted is to be determined during method verification. See Design and Development of Biological Assays (1032), 4. Statistical Aspects of Bioassay Fundamentals, 4.8 Outliers for helpful information on performing outlier detection and rejection, e.g., through a goodness-of-fit tool.]
Calculate the relative potency (RP U1 or 2) percentage for each insulin sample from each assay plate:
RPUx = (EC50,S/EC50,U) × 100
EC50,S = EC50 value for the Standard solution from one assay plate
EC50,U = EC50 value for the Sample solution from one assay plate
Calculate the geometric mean of the relative potency (M) of each insulin sample from both assay plates:
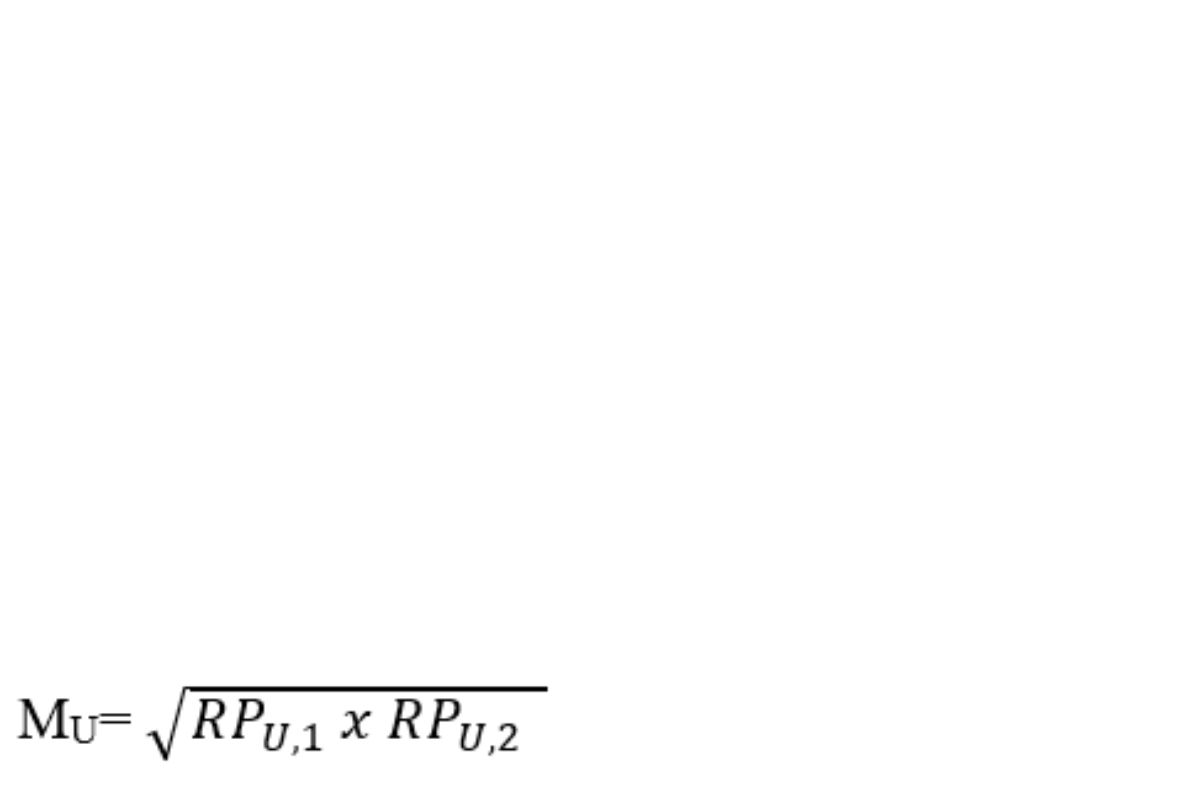
RPU,1 = relative potency of an insulin sample from assay plate 1
RPU,2 = relative potency of an insulin sample from assay plate 2
Calculate the potency of the insulin sample in USP Insulin Glargine Units/mg or USP Insulin Lispro Units/mg:
Potency = (CS x MU)/(CU×100)
CS = concentration of USP Insulin Glargine RS or USP Insulin Lispro RS in the Standard stock solution (USP Insulin Glargine Units/mL or USP Insulin Lispro Units/mL)
MU = geometric mean of the relative potency of each insulin sample from both assay plates
CU = initial concentration of insulin sample (mg/mL)
Parallelism between standard and sample solution curves: See Design and Development of Biological Assays (1032), 4. Statistical Aspects of Bioassay Fundamentals, 4.7 Suitability Testing for helpful information on determining the parallelism by assessing the slope ratio and the upper and lower asymptotes.
Relative standard deviation for EC50: NMT 25% for three EC50 values derived from the triplicate sets of Diluted sample solutions from the same assay plate using the 4-PL free model
Relative bias for relative potency of each individual sample: NMT 35%
Determine the relative bias (RB) for relative potency of each individual sample:
RB=[(RPU1or2/MU)-1) × 100
RPU1or2 = relative potency of an insulin sample from assay plate 1 or 2
MU = average of the relative potency of each insulin sample from both assay plates Mu
2.4.7 System suitability
Generate a dose-response curve by plotting the processed signal responses of all three sets of Diluted standard solutions or Diluted sample solutions from one assay plate against their concentrations on a logarithmic scale using a 4-PL free model. Therefore, one curve representing all three sets of Diluted standard solutions and one curve for all three sets of Diluted sample solutions from one assay plate are generated. Determine the EC50 value for the Standard solution (EC50) and Sample solution (EC50) of each assay plate from the corresponding curve.
Samples: Diluted standard solution and Diluted sample solution
Suitability requirements
Relative standard deviation for EC50: NMT 25% for three EC50 values derived from the triplicate sets of Diluted standard solutions from the same assay plate using the 4-PL free model
Signal-to-noise ratio: The mean signal for the Diluted standard solutions at the highest concentration is NLT 1.5-fold of the mean signal for all Diluted standard solutions at the lowest concentration from the same assay plate.
Acceptance criteria: NLT 15 USP Insulin Units/mg on the as-is basis (USP 1-Dec-2020)
3 ADDITIONAL REQUIREMENTS
3.1 USP REFERENCE STANDARDS (11).
USP Dextrose RS
USP Insulin Aspart RS
USP Insulin Glargine RS
USP Insulin Human RS
USP Insulin Lisero RS
USP Insulin Pork RS
1 Ham's F-12 Nutrient Mixture, GlutamaxTM Supplement, ThermoFisher #31765035 or #31765092, or equivalent.
2 ThermoFisher #10082147 or equivalent.
3 ThermoFisher #14190144 or equivalent.
4 Sigma-Aldrich #A9647 or equivalent.
5 A suitable primary antibody is anti-phosphotyrosine 4G10 mouse monoclonal antibody (1 mg/mL) from Millipore #05-321 or equivalent.
6 A suitable secondary antibody is IRDye 800CW Goat-anti-mouse IgG from LI-COR #926-32210 or equivalent.
7 A suitable fluorescent dye for cell staining is Sapphire700™ Stain #928-40022, or CellTag 700 Stain #926-41090 from LI-COR, or equivalent.
8 A suitable fluorescent DNA dye is DRAQ5™ DNA Stain from Biostatus #DR50050 or #DR50200, or equivalent.
9 An example for preparing a solution containing diluted IRDye® 800CW Goat-anti-mouse IgG, Sapphire 700 Stain, and DRAQ5 DNA Stain is as follows. Prepare the solution containing 1 µg/mL of IRDye® 800CW Goat-anti-mouse-IgG5, Sapphire700" (diluted 1:1000), and 0.5 µM DRAQ5™ in Blocking buffer for secondary antibody. Use this solution within 15 min after preparation.
10 ATCC #CRL-3307.
11 Sigma-Aldrich #A6964 or equivalent.
12 Corning #3904 96-Well Flat Clear Bottom Black Polystyrene Microplates or equivalent.
13 Using a microplate reader with fluorescence detection, such as LI-COR Odyssey Infrared Imaging System or equivalent.
