Image Analysis of Pharmaceutical Systems
If you find any inaccurate information, please let us know by providing your feedback here


Tóm tắt nội dung
- 1. INTRODUCTION AND SCOPE
- 2. APPLICATIONS OF IMAGE ANALYSIS OF PARTICLES
- 2.1 Characterization of Raw Materials in Development
- 2.2 Image Analysis through Life Cycle/Late Stage Manufacturing
- 2.3 Assessing the Contribution of Particle Size and Shape to Bulk Powder Properties Such as Flow and Behavior
- 2.4 Particle Quantitation and Identification of “Foreign Particulate Matter”
- 2.5 Assessing Crystal Growth, Milling, and Dissolution
- 2.6 Studying Particle Properties as a Function of Environmental Conditions
- 2.7 In-Process Monitoring of Particle Properties
- 2.8 Evaluating the Chemical Composition of Materials
- 3. THEORY AND INSTRUMENTATION
- 4. DATA PROCESSING, INTERPRETATION, AND REPORTING
- 5. MEASUREMENT AND EXPERIMENTAL CONSIDERATIONS
- 6. METHOD DEVELOPMENT AND VALIDATION
- REFERENCES
- ADDITIONAL SOURCES OF INFORMATION
This article is compiled based on the United States Pharmacopeia (USP) – 2025 Edition
Issued and maintained by the United States Pharmacopeial Convention (USP)
1 1. INTRODUCTION AND SCOPE
Image analysis is the qualitative or quantitative characterization of two- or three-dimensional digital images. In its simplest form, image analysis is the manual measurement of an image using a scaled ruler. This is a time-intensive way to generate data associated with an image, and it is not in the scope of this chapter (see Optical Microscopy 〈776〉). Image analysis is primarily a size and shape analysis and yields data that are complementary to many other techniques such as laser diffraction and sieve analysis.
Digital image processing and analysis started in the late 1970s, and technology and automation have advanced to enable more routine use of image analysis. Therefore, its applications and use in the pharmaceutical industry are expanding rapidly. Currently, the use of automated image analysis has been expanded to be a valuable research and quality-control tool. For example, where monitoring of particle-size-related parameters was predominant historically, image analysis is increasingly being adopted to complement size with numerous shape measurements and images that offer additional insight into the materials in question.
The purpose of this chapter is to provide general considerations regarding the use of images for particle and material characterization (size and shape analysis, identity, etc.) as well as a standardized approach for the use of the technique in pharmaceutical applications. The chapter also describes the principles of the science that supports the measurement tool.
1.1 1.1 Image
An image is an array of pixels where the pixel position represents the spatial arrangement of the imaged objects within the field of view. Pixel values represent a measured property such as intensity (gray scale), color (intensities for multiple colors), and spectra (absorbance versus wavelength). This chapter concentrates on two-dimensional images, however, it should be noted that the third dimension may also be employed in tomographic methods [nanotomography, atomic force microscopy (AFM), microtomography, etc.] and 3D shape characterization, for example.
Image resolution is important and is defined by the number of pixels per unit area. More pixels improve shape definition and detection of smaller features. This is illustrated in Figure 1, where we can see better resolution for sizing accuracy and shape discrimination. However, system resolution is also impacted by other optical components such as optics and lighting.

Images may be obtained in several ways:
Macroscopic imaging (e.g., photography)
Microscopy [optical microscopy, scanning electron microscopy (SEM), confocal scanning microscopy (CSM), transmission electron microscopy (TEM), and AFM]
Electromagnetic reflection, illumination, and detection [terahertz, infrared, visible, ultraviolet, X-ray, micro-computed tomography (micro-CT), neutron]
Images may also be generated in different environmental conditions (e.g., different temperatures) or during processing, enabling the analysis of transformations.
1.2 1.2 Image Analysis
Image analysis is the derivation of information from the numerical processing of the pixel array. Images are processed using algorithms to differentiate the component parts (often particles) from the background. The data are then analyzed to provide quantitative information such as:
Size (dimensions, separations, etc.) Shape (curvature, aspect ratio, etc.) Surface texture and/or roughness
Number density of features with particular characteristics
Chemical nature (Mid-Infrared Spectroscopy—Theory and Practice 〈1854〉, Near-Infrared Spectroscopy—Theory and Practice 〈1856〉, and Raman Spectroscopy —Theory and Practice 〈1858〉)
Classification of different types of features within a sample; this could be done to quantify components of the same species with different morphological profiles (in its simplest form, those that are larger/smaller) or it could be to differentiate between components of the image
Image analysis is employed in many fields with applications as diverse as astronomy, medicine/biology, meteorology, satellite imaging, facial recognition, geology, agriculture, materials science, pharmaceuticals, and other industrial applications. The content of this chapter is limited to pharmaceutically relevant applications of image analysis, including the following: Characterization of particle size, shape, and texture
Mixture composition and uniformity
Orthogonal technique complementary to other physical analyses Bulk materials characteristics and processability
Foreign particulate matter detection, quantification, and/or identification in the visible and subvisible ranges
Within pharmaceutical, medical, and biological applications there are other examples not covered in this chapter, including the following: Defect detection and identification (e.g., vials, tablets, packaging, printing) using machine vision systems
Fill level detection and verification
Biological tissue characterization such as microscopic and macroscopic imaging in pathology and radiology [e.g., X-ray, CT, magnetic resonance imaging (MRI)]
Clinical applications such as pathology and diagnostics
2 2. APPLICATIONS OF IMAGE ANALYSIS OF PARTICLES
2.1 2.1 Characterization of Raw Materials in Development
Image analysis is a useful tool in characterization of the active pharmaceutical ingredients (APIs) throughout the development process. One of the advantages at the early development stage is that a multiparameter, full description of particles is possible from a small quantity of material (e.g., milligrams). At the early stages, physical characteristics may vary between different lots of raw materials. Aspects of particle morphology can be monitored and optimized for drug delivery, formulation, and processing. This also enables the optimization of the API synthesis process. Examples include assessing particle roughness for respiratory formulations, particle size and shape distribution for solid dosage formulations, and particle morphology for suspension formulations. Use of early phase image analysis can support formulation and process development in the later phases.
In the later stages of development, a broader understanding of the particle morphology of the API and its impact on the formulation process can be obtained by image analysis than by the more traditional techniques (e.g., laser diffraction, optical and scanning microscopy, and specific surface area). Image analysis may also be a key technique in characterization of excipients, intermediates, and the formulated drug product. For example, image analysis may show that a well-defined range of size distribution of raw materials is needed to avoid segregation during powder-blending steps or that the granule size distribution can be optimized for compression.
2.2 2.2 Image Analysis through Life Cycle/Late Stage Manufacturing
Image analysis is also employed throughout the product life cycle in such areas as the investigation of process changes and quality by design (QbD). This enables predictive trending for raw material changes (API and excipients) and tracking of crystallization/crystal growth, thereby allowing the definition of in-process specifications.
Quality control is another area where image analysis can serve as a useful tool. Raw materials can be tested for size as well as for aspects of shape, such as smoothness, which impact both flowability and mixing (1). Ensuring consistency in overall size and shape as well as identifying an overpopulation of fine particles or larger agglomerates is an advantage of image analysis over size-only methods. In API manufacturing, image analysis systems also allow for number-based assessment of crystal growth and concentration as well as crystal milling to ensure proper size and shape of API material.
Raw materials and finished product may also be assessed for the presence and quantity of intrinsic or foreign particles.
2.3 2.3 Assessing the Contribution of Particle Size and Shape to Bulk Powder Properties Such as Flow and Behavior
Particle morphology may have a significant impact on a powder’s suitability for different pharmaceutical applications (2). Even relatively minor variations in these physical properties can affect interparticulate forces, which in turn influence powder flow, packing, and in- process/application behavior. Image analysis enables quantification of particle size and shape properties of the bulk powder. In addition, as it is fundamentally a number-based technique (see 4.2.3 Data Reporting), it provides insight into the presence of low quantities of particles with a specific morphology compared to the bulk, such as the presence of fine particles, information that may not be obvious when measuring by volume-based techniques alone.
Clear relationships have been observed between particle size, shape, and flow properties under a range of different process conditions (3) such as:
The presence of fine particles may cause sticking
Particle shape may determine the extent of particle interlocking, entrained air, and bed permeability Fine particles and/or irregular particle shape can lead to bridging and blockages
Morphology may influence particle–particle friction, determining the ease with which particles shear against each other whether as APIs, excipients, or blends
Particle shape may influence particle interactions with equipment surfaces and other media
Process operations where particle parameters are important for considering powder behavior include: Flow out of hoppers and intermediate bulk containers (IBCs) and flow into tablet dies (4)
Use of dry powder inhalers (DPIs), as particles entrained in an air flow during conveying or dispersion will experience different drag forces and therefore different terminal velocities
Variation in aerodynamic behavior contributes to the complex interactions between the carrier and drug particles within an assembly during aerosolization and affects impact energies during collisions, which are recognized as important factors contributing to DPI efficacy (5)
2.4 2.4 Particle Quantitation and Identification of “Foreign Particulate Matter”
It is possible to generate information on the quantity, size, and shape of particles including contaminants. Contaminants may be identified through a combination of size, shape, opacity, and/or color differentiation or identified from the particle images themselves. In some cases, staining the sample may help identify and separate contaminants. If a suitable combination technology is used, such as electron microscopy coupled with energy dispersive X-ray (EDX) or optical microscopy coupled with Raman spectroscopy, the chemical composition of contaminants can also be determined.
The maximum number of particles that are permissible in a specific mass or volume of sample is addressed in Particulate Matter in Injections 〈788〉 , Visible Particulates in Injections 〈790〉 , Methods for the Determination of Subvisible Particulate Matter 〈1788〉, and Visual Inspection of Injections 〈1790〉.
2.5 2.5 Assessing Crystal Growth, Milling, and Dissolution
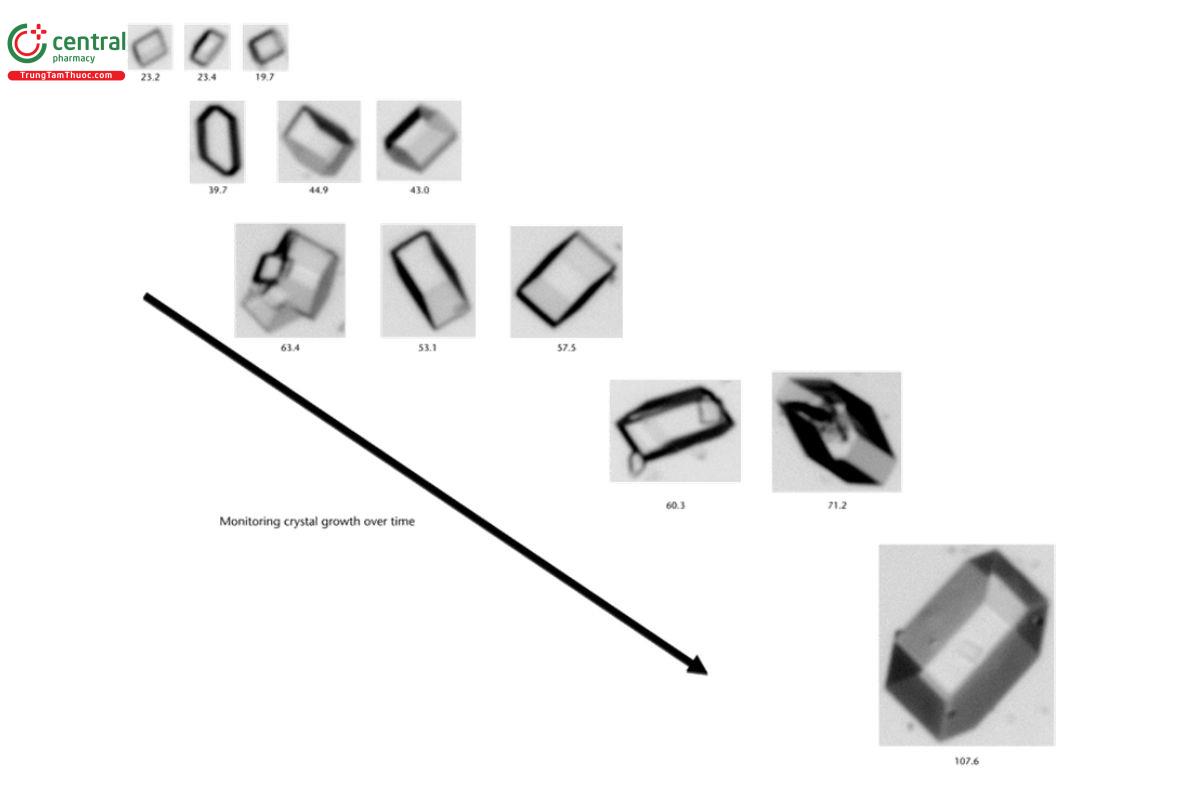
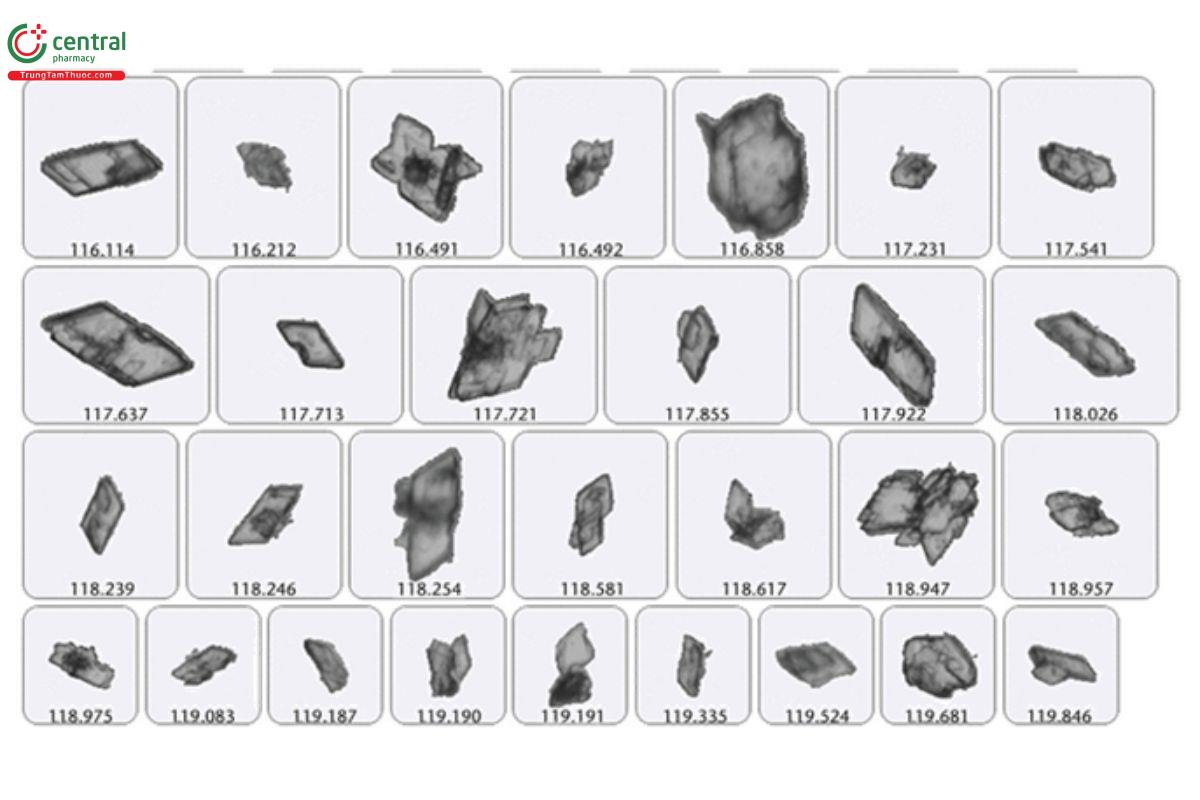
Crystallization is a key step in almost every process in the manufacturing of pharmaceutical compounds. Crystallization is often used as a purification step. Image analysis of crystal growth can be used to detect the starting point (when nucleation begins) and then used to record event data. As the crystallization process advances, image analysis systems can capture in real time the size, shape, and concentration data as well as thumbnail images that serve as objective evidence of the process. This is all captured in a series of sequential analyses and compared over time. These data can then be used to study the rate of crystallization and how the crystal shapes form over time under different conditions. In some cases, instrumentation can be used to notify the end user when select shape and size conditions are met. The different shapes can help identify how these crystals can impact bioavailability, solubility, and dissolution rates.
The images in Figure 2 were taken from a crystallization process where sequential analyses were taken. Each analysis captures the size, shape, concentration, and thumbnails of the crystal particles. As the subsequent runs are taken, the crystal particles are growing in size, changing in shape, and increasing in concentration. Thumbnail images are used as objective evidence to backup the large amount of particle data saved for each analysis.
2.6 2.6 Studying Particle Properties as a Function of Environmental Conditions
Another example of using image analysis as a tool to study particles while environmental conditions are applied is dissolution testing. This method is the reverse of the process described above. Image analysis can be used to sample small aliquots of the representative sample from a starting point to an end point. Because image analysis can classify particles based on shape, it is possible to monitor the size and concentration of multiple components being released by therapeutics over time, with images captured to serve as objective evidence.
Time-lapse image analysis can be used to monitor particle size and shape as a result of being subjected to changes in process parameters and environmental conditions (e.g., heat, humidity, physical stress, and time), typically achieved by using an environmentally controlled chamber. An image analysis system can capture images of the samples as the conditions are adjusted, or it can record images at set intervals. The added value that image analysis provides over size-only systems for monitoring particle properties over time is the ability to classify particles based on shape, to quantify particles per unit volume (concentration of the particles of interest), and to provide objective evidence of the particles as they change over time with thumbnail images. Analysis intervals can be established using the starting point of interest and the point at which the ending condition occurs based on the environmental condition applied. Particle data results can then be compared in a sequence over time to study how the environmental conditions to which the particles were subjected caused physical changes in shape and concentration.
Another example is hot-stage microscopy (HSM), which can be utilized to analyze particle properties as a function of temperature. This microscopy technique monitors both particle size and shape as materials are heated on a "hot stage" from which the technique gets its name (6 ). In pharmaceutical applications, this technique is typically used to investigate API crystal growth and polymorphism. A lack of understanding and control over the different polymorphs formed by an API can lead to significant changes in particle morphology, influencing tableting performance and dissolution rates.
2.7 2.7 In-Process Monitoring of Particle Properties
In-process monitoring of particle properties can have many advantages over the more conventional off-line analyses. For example, process downtime can be minimized as it is not necessary for aliquots to be removed from process equipment for off-line analysis and results. In addition, materials are measured under their processing conditions, and the data is likely to be representative of a greater proportion of processed material.
The increased use of in-process techniques for particle imaging is consistent with guidance from the International Council for Harmonisation of Technical Requirements for Pharmaceuticals for Human Use (ICH) and the US Food and Drug Administration (FDA) for better process understanding and monitoring (7).
2.8 2.8 Evaluating the Chemical Composition of Materials
Image analysis combined with spectral information may provide chemical insight into materials. The area of chemical imaging is growing with an ever-expanding range of combination techniques, and instrumentation. Such techniques may use vibrational, fluorescence, physical, or other responses to probe the chemical composition of a species. These techniques include: SEM with EDX, optical image analysis with Fourier-transform infrared (FTIR) or Raman microscopy (8), confocal fluorescence microscopy, atomic force microscopy, nanotomography, and MRI. With X-ray microcomputed tomography (XMT) (9 ), it may even be possible to image the packed product, for example within a blister or a tube.
These techniques may be applied to particles, granules, and certain formulated products, which are DPIs (10), oral solid drug products, nasal sprays (11), and semisolid formulations, to gain insights into the chemical distribution of materials within a sample (12). These techniques may also be useful for understanding the chemical changes in a formulation over time, and in investigations of possible contamination.
3 3. THEORY AND INSTRUMENTATION
The following discussion is limited to optical systems as these cover the majority of applications.
3.1 3.1 Basics of Image Acquisition
Image acquisition systems consist of several instruments: an illumination source, a sample presentation unit, an optical system that magnifies the sample, an image capture device, and data processing software to perform the image analysis that provides the particle data.
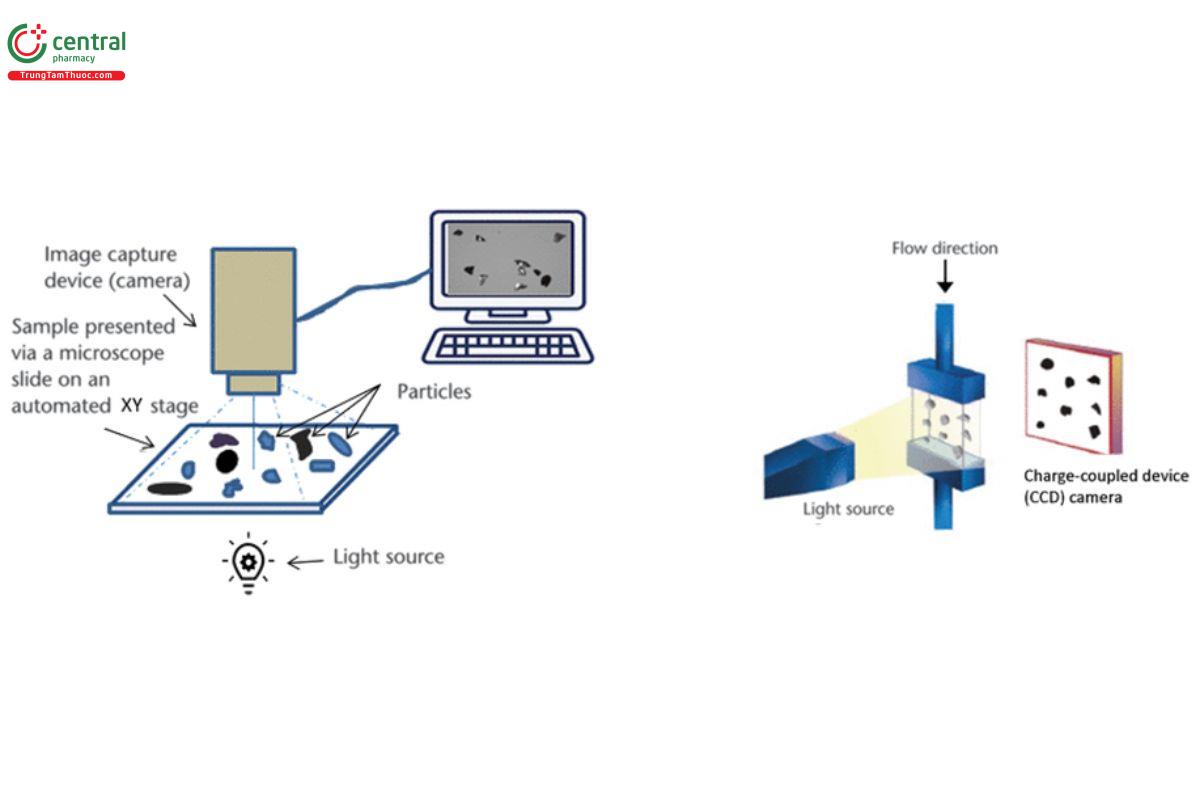
Image analysis systems typically come in two broad types, static and dynamic, which differ on the basis of sample presentation method (Figure 3). With static systems, the particles (dispersed as dry powder or as wet suspension, or captured on a filter) remain static on a presentation cell within an automated stage that moves under the optics. With dynamic systems, particles dispersed as a suspension (either dry in air or wet in a liquid medium) travel through a flow cell and images are taken as the particles are in motion.
3.1.1 3.1.1 ILLUMINATION
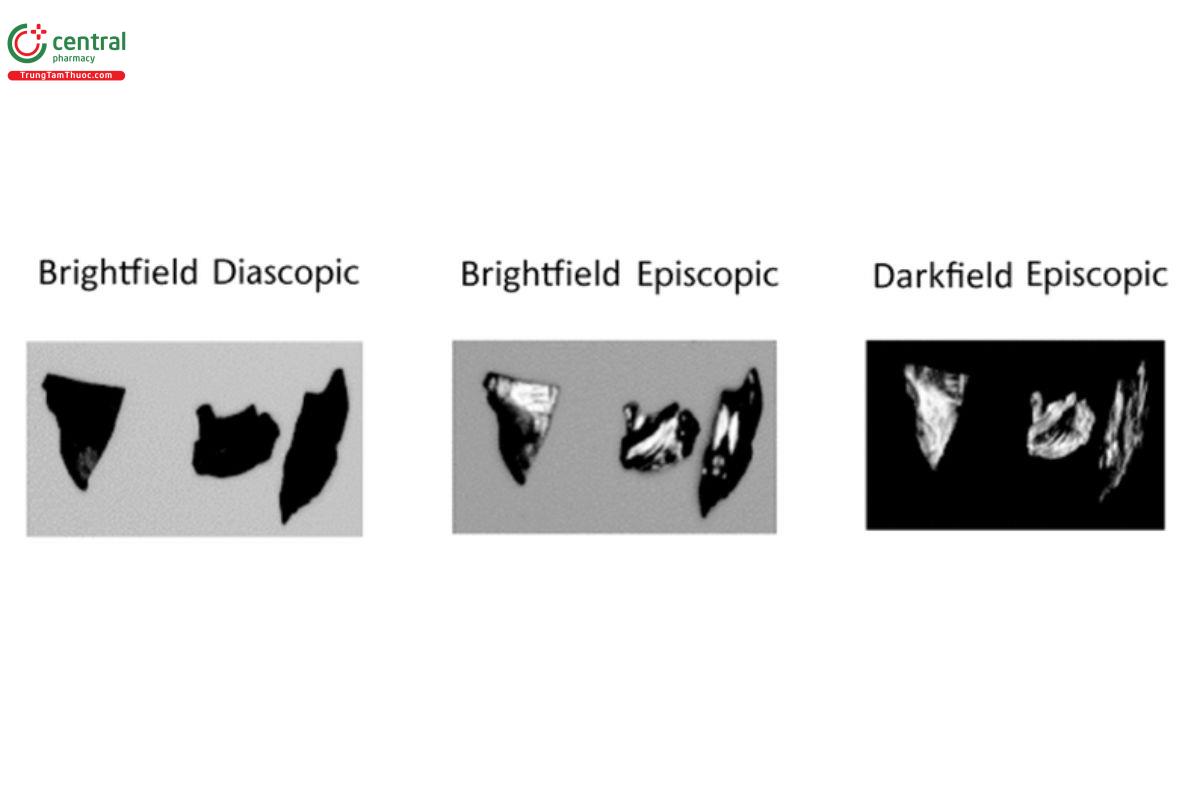
Illumination techniques are either stroboscopic or fixed, and the goal is to obtain a clear image with as much edge definition as possible to enable suitable detection and measurement. Depending on the system configuration, illumination options may include diascopic (transmitted) or episcopic (reflected) and brightfield or darkfield (Figure 4). In addition to proper illumination, optical filters and polarizers may be used to further improve the edge definition of particles being analyzed.
3.1.2 3.1.2 SAMPLE PRESENTATION
For successful image analysis, it is critical that the sample presentation be appropriate for the measurement technique. When measuring bulk properties, specific components, or foreign particulate matter, it is important to ensure that the aliquot measured is representative of the bulk material (see Bulk Powder Sampling Procedures 〈1097〉).
Factors that affect results include the sample volume or concentration and the conditions used to disperse the sample. Adequate particle separation is required without particle breakage. Particles should be appropriately dispersed to ensure that there are clear boundaries between distinct particles and agglomerates, thereby avoiding coincidence or unwanted agglomeration/flocculation, as these could be misrepresented as larger particles. Equally important, particle damage can result if dispersion aids such as pressure or ultrasound are used, which would also misrepresent the sample results. For wet or dry dispersions, it is important to optimize the appropriate dispersion methods and conditions.
Specific applications discussed above may have different sample preparation considerations.
Dynamic image analysis systems may include wet and/or dry dispersion units. Wet dispersion is usually achieved by controlled stirring, and the use of ultrasound may also be an option. Dry dispersion is usually achieved via gravity fall or with the aid of differential air pressure. Many static image analysis systems utilize dry powder dispersion units, which control differential air pressure for dispersing the sample.
Wet samples are presented in specific cells or are filtered. The latter is typical for low-concentration foreign particulate matter applications. Some sample types such as topicals and viscous suspensions (e.g., nasal sprays) are prepared using classic microscope techniques with the sample sandwiched between a slide and coverslip.
3.1.3 3.1.3 OPTICAL SYSTEM
Once the sample is properly prepared to ensure statistical accuracy, the next step is to magnify the images to fit on the optical field of view. As larger magnifications are used, the field of view becomes smaller (see Figure 5).
When zooming into an image, the detection zone becomes smaller (see Figure 5, far below). It is important to take this into consideration to ensure that proper sampling is performed. Use of excessive magnification may underrepresent larger particles because it becomes less likely that they will appear fully in the field of view. Statistically, this would skew the results toward the smaller sample population.
Conversely, as magnification is decreased to see the larger particles properly, smaller particles may fall outside the detection ability of the instrument configuration, skewing the results toward the larger size particles. Due to inherent limitations for a given magnification, a compromise between these two factors may be needed, with consideration of the purpose of the application.
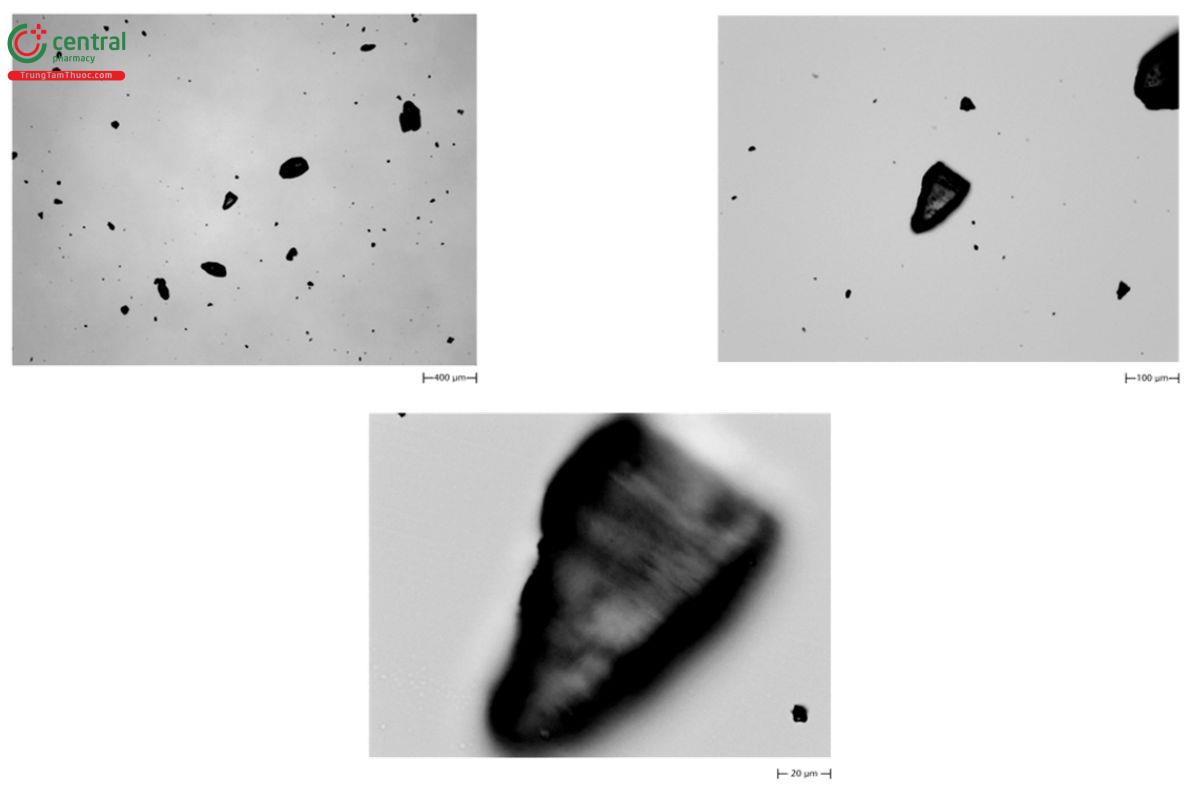
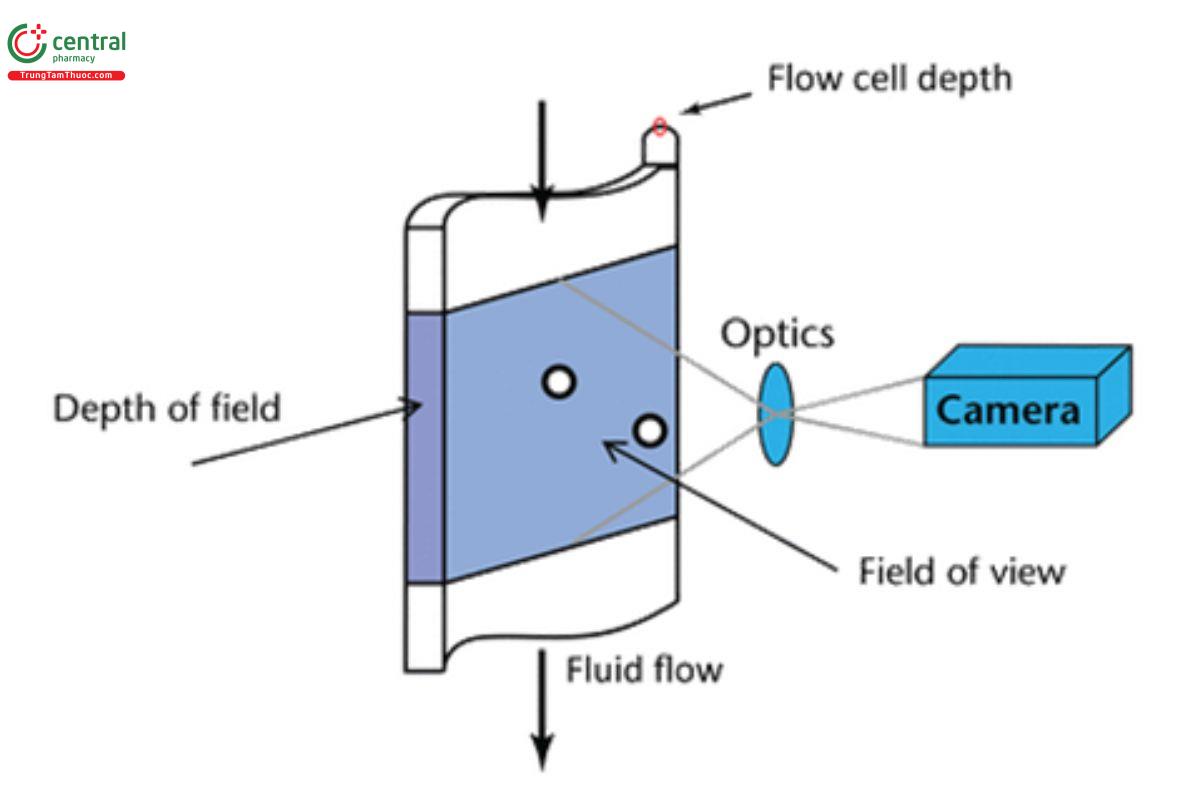
Figure 6 shows the field of view and depth of field of flow cell in a dynamic image analysis system.
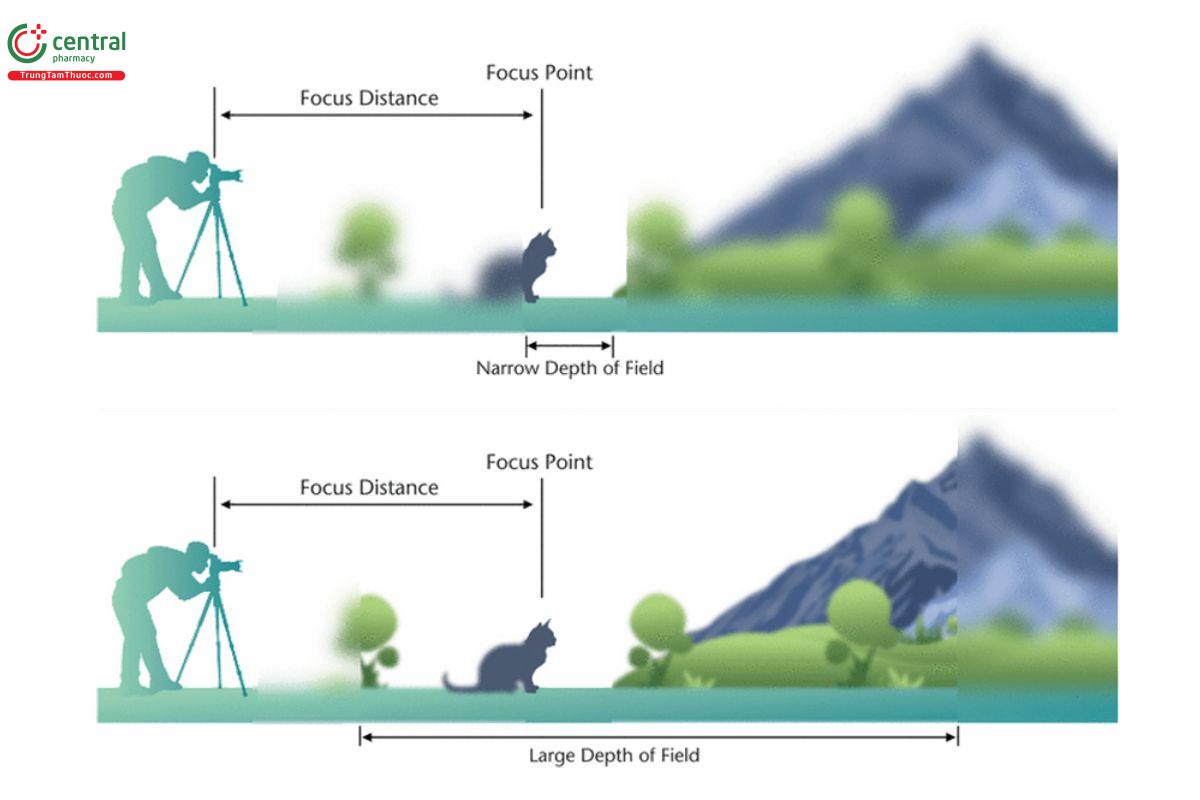
Depth of field (DoF) will also be a factor; it is the distance between the nearest and farthest objects (particles) that are in an acceptably sharp focus within an image (see Figure 7). DoF is generally controlled by the optical components of the imaging system, which includes the aperture or f-stop. Generally, as the aperture is smaller, the DoF is larger. The degree to which a user has DoF control will depend on the instrumentation; many manufacturers provide the largest DoF possible in order to minimize out-of-focus particles for analysis.
4 4. DATA PROCESSING, INTERPRETATION, AND REPORTING
4.1 4.1 Data Processing
Software processing is the next step after image capture. Once images have been captured and are available for processing on a computer, image analysis systems perform a series of functions to identify particles on every image.
Operations may be applied to the gray level images to enhance further processing, for example adjustments to brightness and contrast.
For the scope of this chapter, the majority of applications being considered involve measurements of individual particles, often a large number of them, within a given image. It is necessary to identify and define the boundaries of the individual particles. This is often done by defining a threshold gray level value and defining the desired objects as above or below that level (light, dark, color, or other appropriate value). However alternative edge detection and combined algorithms are used by some systems.
Once the desired objects have been identified, further processing is necessary for accurate measurements (e.g., separation of closely spaced or touching objects). The required criterion for an analyzable discrete object will be a minimum number of associated pixels, which will depend on the application (see Figure 1).
The gray-scale images are converted to a binary format for the purposes of size and shape calculations. The size and the number of pixels are used to accurately characterize images and calculate the particle size and shape parameters. Some systems report the binarized particle images, whereas others retain the gray-scale images, which may provide additional information about the samples, such as texture. This is important if qualitative information about the objects is required.
4.2 4.2 Data Interpretation and Reporting
4.2.1 4.2.1 SIZE PARAMETERS
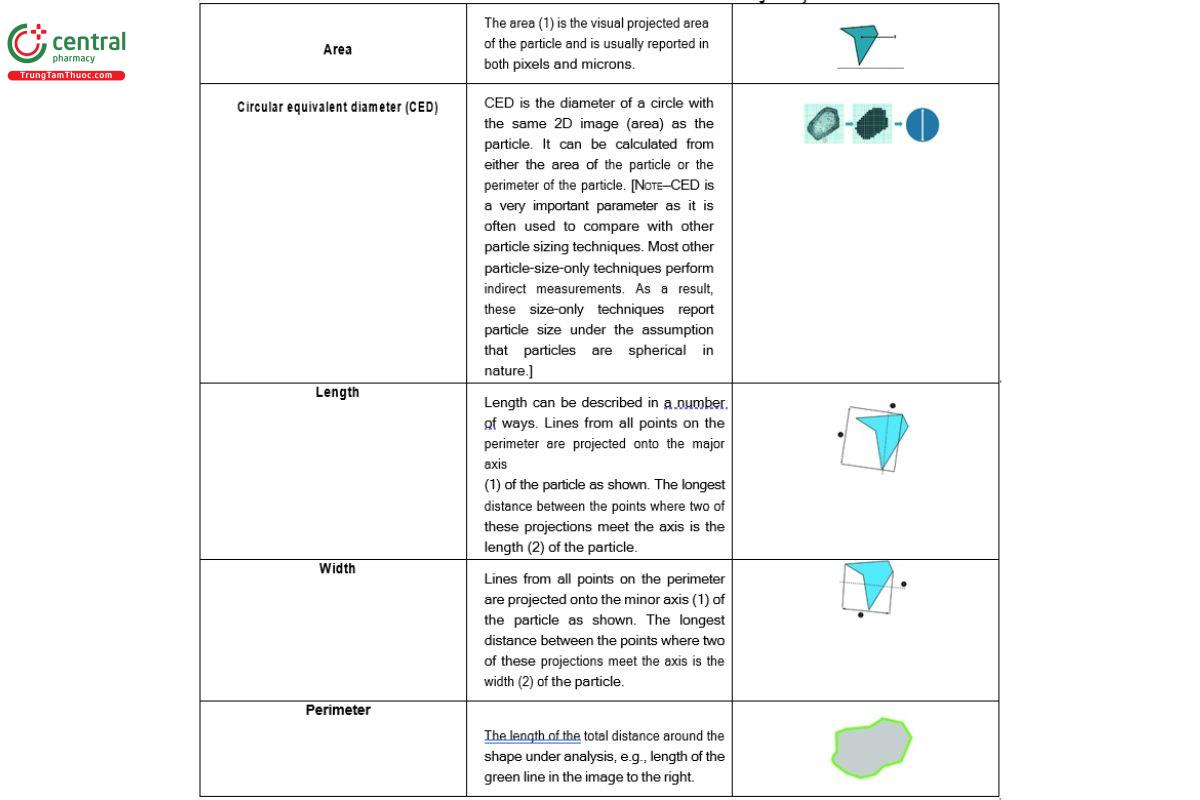
Image analysis calculates a variety of particle size parameters derived from the size of the pixels, which relates to the magnification used and the number of pixels per unit area. Size parameters that are typically reported are described in Table 1.
There are a number of aspects used to describe the dimensions of a particle, such as various diameters or chords. Common measures include the Feret and Martin diameters or the dimensions of bounding circles, rectangles, or other polygons. Depending on the measure used, the definition of descriptors such as length or width may differ. One must be aware of the definitions used by specific instrument systems and software.
Table 1. Most Common Size Parameters Used in Image Analysis
4.2.2 4.2.2 SHAPE PARAMETERS
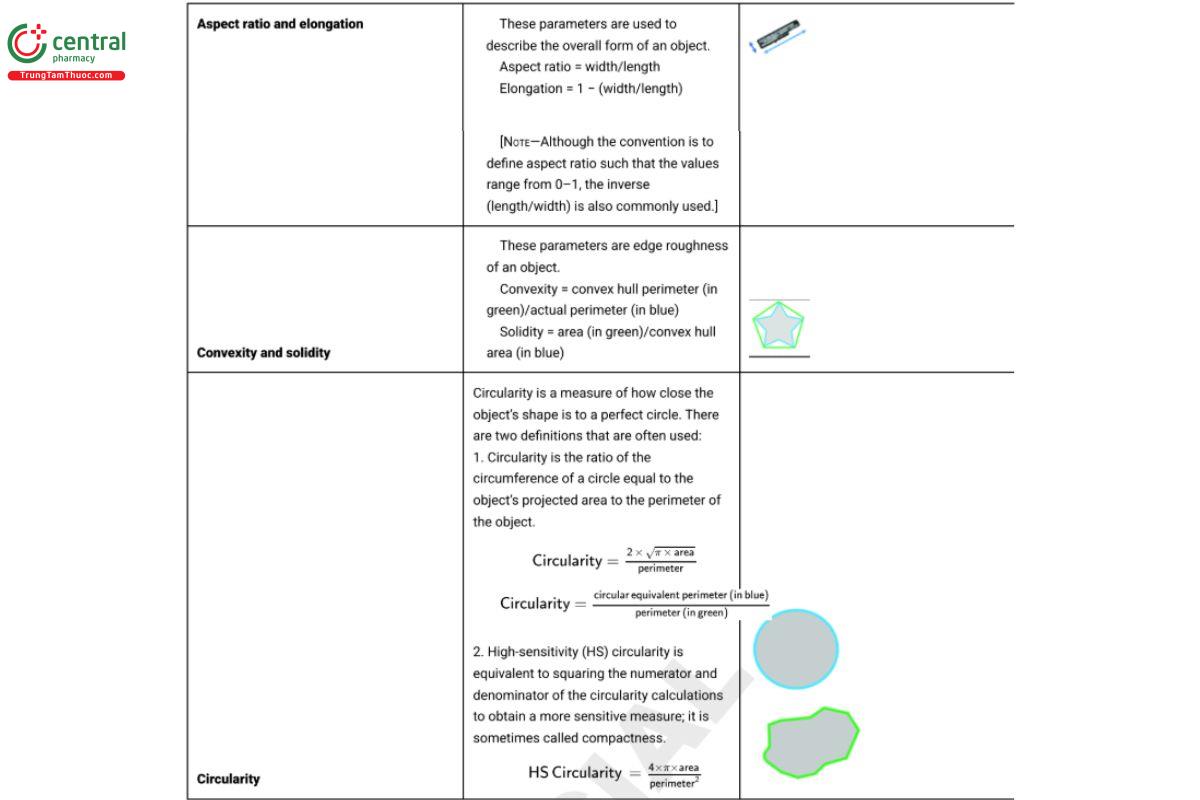
Shape measures are essentially combinations of the basic size measurements. Those typically reported are described in Table 2.
Table 2. Most Common Shape Parameters Used in Image Analysis
Some applications may make use of gray level measurements. These could include gray level averages or gray level distributions in the image or specific regions of interest, determination of a gray level profile along a defined line, or other measurements. One common application for gray level processing is the differentiation of particles based on opacity where two particles can be identical in size and shape but one may be darker than the other when viewed as an image (see Figure 8).
4.2.3 4.2.3 DATA REPORTING
Detailed individual particle data are typically reported along with the particle images providing key qualitative information as well as whole sample distributions and statistics.
For every parameter measured, statistical histograms are created (see Figure 9 ). The full distributions can be compared across samples, which may enable the detection of differences among samples when statistically relevant data are used to differentiate populations of particles from one another.
Imaging is a number-based technique but mathematical conversion to volume results is typically available to compare results with those of other techniques (13). However, care must be taken with such comparison because different techniques calculate sizes on the basis of different factors.
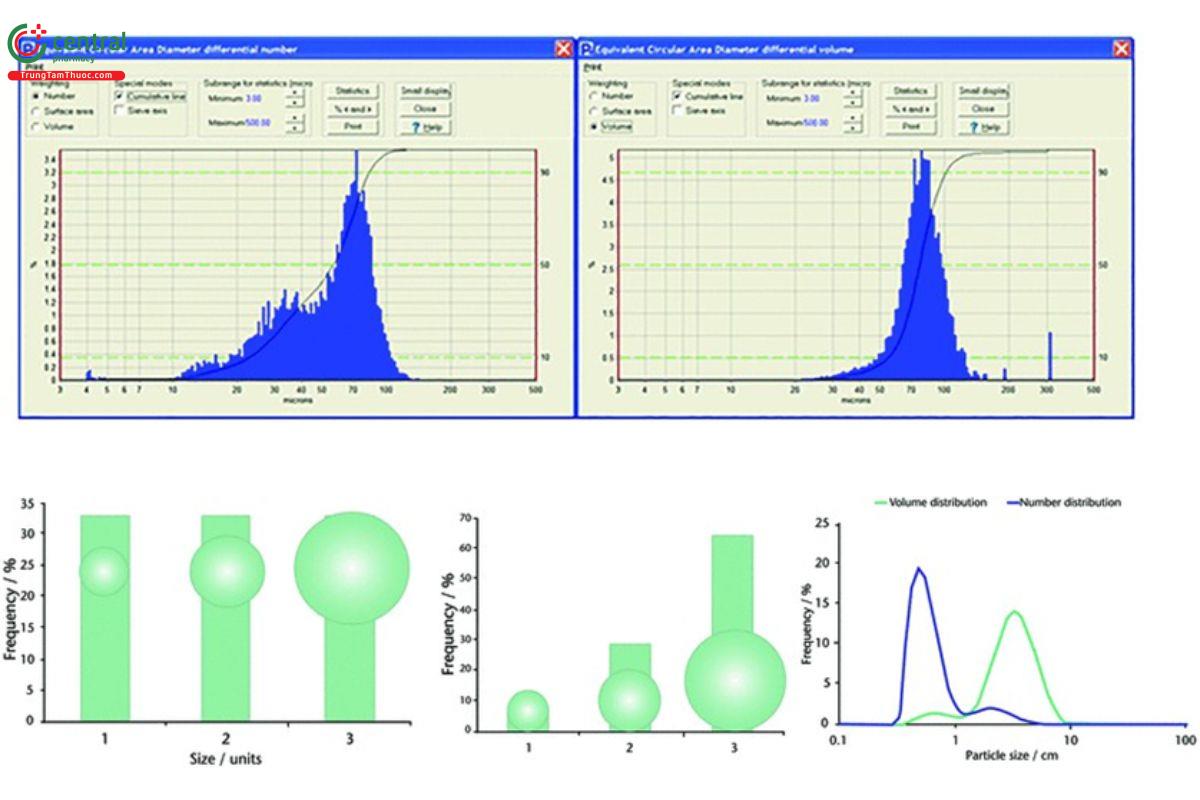
The two histograms in Figure 9 may look very different, but they represent the same sample. The histogram on the left is a number- weighted distribution, and the one on the right is a volume-weighted distribution. Because it is a number-based method, image analysis has the ability to identify and quantify fine particles, as is well shown with the number-weighted distribution. This enables end users to identify the presence of fine particles in their sample regardless of the amount. As discussed in this and other USP chapters, the presence of fine particles can significantly impact the powder flowability of the sample. This can also be used as a tool to assess the performance of milling processes. Volume-weighted distributions are also very useful for identifying and quantifying large, rare events such as agglomerates, bubbles, or contamination. It is important to keep in mind that with a number-based system, end users are able to view single particle events that appear on histograms as objective evidence.
Many systems also offer the ability to classify particles according to particle size and/or shape combinations, providing further insight into the samples. Systems combined with spectroscopic techniques allow further classification by elemental or chemical nature.
5 5. MEASUREMENT AND EXPERIMENTAL CONSIDERATIONS
5.1 5.1 Size Calibration
For accurate size measurements, the magnification of the system must be calibrated. A size standard of suitable quality must be used. For optical microscopy-based systems, this is most often a stage micrometer or reticle. The image of the standard should span as large a portion of the image field as possible to maximize the number of pixels used. This method is most suitable for static systems. For dynamic systems, although calibration with a reticle or micrometer may be possible, it is most commonly accomplished using well-characterized standard particles of known size. Once calibrated, a given optical arrangement (e.g., a set of lenses) will normally be maintained. However, it is good practice to check the sizing accuracy periodically, or prior to critical measurements. Shape factors are scale independent and should not be affected by the sizing accuracy.
5.2 5.2 Factors That Affect the Measurement
5.2.1 5.2.1 SPATIAL ACCURACY
In most applications, it is presumed that the pixel array accurately represents the geometry of the imaged object. However, there are potential sources of inaccuracy and asymmetry in the image.
Asymmetry may arise from both the optics used to acquire the image and the detector elements. To assess the potential for inherent asymmetry in the experimental arrangement, spatial calibration should be checked at multiple angles, both within a given image and in the arrangement of the dimensional standard.
Another source of geometric inaccuracy within an image is due to the DoF and focus. If objects are not in the same physical focal plane, their relative perceived sizes could be inaccurate due to perspective. Likewise, with a limited DoF, objects at different distances from the collecting optics will differ in focus. The measured size of objects not sharply focused will be dependent on the thresholding values used to discriminate boundaries (see 3.1.3 Optical System).
5.3 5.2.2 GRAY LEVEL ACCURACY
For many applications, especially those dealing with the size and shape of individual particles, the accuracy of gray level values is not needed. When extracting quantitative information from gray levels, such as a concentration, it is necessary to consider factors affecting the accuracy of gray level values. Detector response to intensity may not be linear or may be affected by illumination wavelength. Software factors such as adjustments to brightness and contrast or the application of other image enhancement filters, such a gamma distribution, will affect the apparent response. Users should be aware of default software settings for such factors to avoid unintended effects.
6 6. METHOD DEVELOPMENT AND VALIDATION
The major consideration for method development is the purpose of the measurement (i.e., is the primary goal to measure size or shape?). Among the factors to be considered are:
Sample characteristics (e.g., size range of the particles) Level of assurance needed for accuracy and precision
Sample, equipment, or time limitations
Optimization of the conditions will apply to all phases of the image analysis process:
Sampling and sample preparation
The sample must be representative
The sample preparation must disperse the particles as intended
There must be adequate numbers of particles in the image (i.e., images of a statistically representative number of particles are captured for analysis)
Appropriate image acquisition parameters
Illumination should be uniform and suitable to aid discrimination of particles from background Magnification must be appropriate for the purpose
Fine shape features will often require higher magnification
Magnification must balance accuracy of sizing of small particles while avoiding exclusion of larger particles
Application of appropriate data processing and statistical analysis Sample orientation (fixed versus random orientation)
As with all analytical methods, consistency is key to ensuring accurate, representative results. Analysts must be familiar with the equipment and potential sources of error. Detailed method conditions will be equipment specific. For method validation, the normal considerations apply, namely precision, accuracy, and ruggedness.
7 REFERENCES
1. Gamble JF, Tobyn M, Hamey R. Application of Image-Based Particle Size and Shape Characterization Systems in the Development of Small Molecule Pharmaceuticals. Journal of Pharmaceutical Sciences. 2015;104(5):1563–1574.
2. Gamble JF, Chiu WS, and Tobyn M. Investigation into the impact of sub-populations of agglomerates on the particle size distribution and flow properties of conventional microcrystalline cellulose grades. Pharmaceutical Development and Technology. 2011;16(5):542– 548.
3. Fu X, Huck D, Makein L, Armstrong B, Willen U, Freeman T. Effect of Particle Shape and Size on Flow Properties of Lactose Powders. Particuology. 2012;10:203–208.
4. Shekunov BY, Chattopadhyay P, Tong HHY, Chow AHL. Particle Size Analysis in Pharmaceutics: Principles, Methods and Applications. Pharm Res. 2007;24(2):203–227.
5. Hassan MS, Lau RWM. Effect of Particle Shape on Dry Powder Inhalation: Study of Flowability, Aerosolization, and Deposition Properties. AAPS Pharm Sci Tech. 2009;10(4):1252–1262.
6. Panna W, Wyszomirski P, Kohut P. Application of hot-stage microscopy to evaluating sample morphology change on heating. J Therm Anal Calorim. 2016;125(3):1053–1059.
7. Zhou Y, Doan X-T, Srinivasan R. On-Line Monitoring of Particle Shape and Size Distribution in Crystallization Processes through Image Analysis. 17th European Symposium on Computer Aided Process Engineering (ESCAPE17). 2007.
8. Scoutaris N, Vithani K, Slipper I, Chowdhry B, Douroumis D. SEM/EDX and Confocal Raman Microscopy as Complementary Tools for
the Characterization of Pharmaceutical Tablets. Int J Pharm. 2014; https://doi.org/10.1016 /j.ijpharm.2014.05.007.
9. Yost E, Chalus P, Zhang S, Peter S, Narang AS. Quantitative X-Ray Microcomputed Tomography Assessment of Internal Tablet Defects. J Pharm Sci. 2019;108(5):1818–1830.
10. Price R, Farias G, Ganley W, Shur J. Demonstrating Q3 Structural Equivalence of Dry Powder Inhaler Blends: New Analytical Concepts and Techniques. Respiratory Drug Delivery. 2018;1:265–276. https://www.rddonline.com/rdd/article.php?ArticleID=2374.
11. Liu Q, Absar M, Saluja B, Guo C, Chowdhury B, Lionberger R, Conner DP, Li BV. Scientific Considerations for the Review and Approval of First Generic Mometasone Furoate Nasal Suspension Spray in the United States from the Bioequivalence Perspective. The AAPS Journal. 2019;21:14.
12. Gamble JF, Hoffmann M, Hughes H, Hutchins P, Tobyn M. Monitoring process induced attrition of drug substance particles within formulated blends. International Journal of Pharmaceutics. 2014;470(1);77–87. https://doi.org/10.1016 /j.ijpharm.2014.04.028.
13. Jones JW, Tobyn M, Greenwood R, Ingrama A. Alternative approach for defining the particle population requirements for static image analysis based particle characterization methods. Advanced Powder Technology. 2019;30(5):920–929. https://www.sciencedirect.com/science/article/pii/S09 21883119 300275.
8 ADDITIONAL SOURCES OF INFORMATION
International Organization for Standardization. ISO 13322-1:2014: Particle size analysis—Image analysis methods—Part 1: Static image analysis methods.
International Organization for Standardization. ISO 13322-2:2006: Particle size analysis—Image analysis methods—Part 2: Dynamic image analysis methods.
ASTM Designation: E1617–09 (2019): Standard Practice for Reporting Particle Size Characterization Data. https://www.astm.org/Standards/E16 17.htm.
ASTM Designation: E2578–07 (2018): Standard Practice for Calculation of Mean Sizes/Diameters and Standard Deviations of Particle
Size Distributions. https://www.astm.org/Standards/E2578.htm.
ASTM Designation: E2651–19: Standard Guide for Powder Particle Size Analysis. (USP 1-Aug-2022)
