Color - Instrumental Measurement
If you find any inaccurate information, please let us know by providing your feedback here

Tóm tắt nội dung
This article is compiled based on the United States Pharmacopeia (USP) – 2025 Edition
Issued and maintained by the United States Pharmacopeial Convention (USP)
DOWNLOAD PDF HERE
The observed color (see 〈631〉 Color and Achromicity) of an object depends on the spectral energy of the illumination, the absorbing characteristics of the object, and the visual sensitivity of the observer over the visible range. Similarly, it is essential that any instrumental method that is widely applicable take these same factors into account.
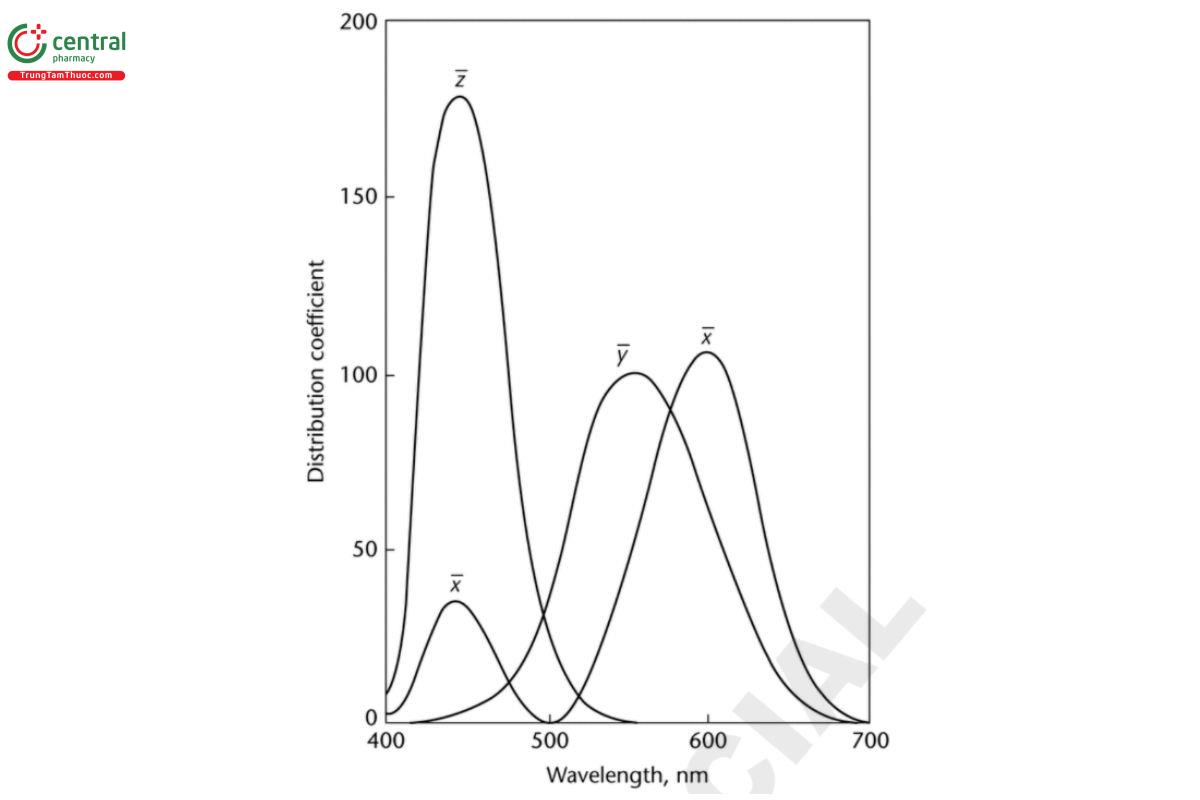
Instrumental methods for measurement of color provide more objective data than the subjective viewing of colors by a small number of individuals. With adequate maintenance and calibration, instrumental methods can provide accurate and precise measurements of color and color differences that do not drift with time. The basis of any instrumental measurement of color is that the human eye has been shown to detect color via three “receptors.” Hence, all colors can be broken down into a mixture of three radiant stimuli that are suitably chosen to excite all three receptors in the eye. Although no single set of real light sources can be used to match all colors (i.e., for any three lights chosen, some colors require a negative amount of one or more of the lights), three arbitrary stimuli have been defined, with which it is possible to define all real colors. Through extensive color-matching experiments with human subjects having normal color vision, distributing coefficients have been measured for each visible wavelength (400 nm to 700 nm) giving the relative amount of stimulation of each receptor caused by light of that wavelength. These distribution coefficients x, y, z, are shown below. Similarly, for any color the amount of stimulation of each receptor in the eye is defined by the set of Tristimulus values (X, Y, and Z) for that color.
The relationships between the distribution coefficient (see accompanying flgure) and the tristimulus values are given in the equations

is the spectral power of the illuminant, and f is either the spectral re ectance (ρλ) or spectral transmittance (τλ) of the material.
Once the tristimulus values of a color have been determined, they may be used to calculate the coordinates of the color in an idealized three-dimensional color space referred to as a visually uniform color space. Many sets of color equations have been developed in an attempt to define such a space. The equations given in this chapter represent a compromise between simplicity of calculation and conformance with ideality.
The coordinates of a color in a visually uniform color space may be used to calculate the deviation of a color from a chosen reference point. Where the instrumental method is used to determine the result of a test requiring color comparison of a test preparation with that of a standard or matching fluid, the parameter to be compared is the difference, in visually uniform color space, between the color of the blank and the color of the test specimen or standard.
1 PROCEDURE
The considerations discussed under Ultraviolet-Visible Spectroscopy 〈857〉 apply to instrumental color measurement as well. In the spectrophotometric method, reflectance or transmittance values are obtained at discrete wavelengths throughout the visible spectrum, a band width of 10 nm or less being used. These values are then used to calculate the tristimulus values through the use of weighting factors.1 In the colorimetric method, the weighting is performed through the use of filters.
In the measurement of the spectral reflectance of opaque solids, the angle of viewing is separated from the angle of illumination in such an manner that only rays reflected diffusely from the test specimen enter the receptor. Specular reflection and stray light are excluded.
For the measurement of the spectral transmittance of clear liquids, the specimen is irradiated from within 5 degrees of the normal to its surface, and the transmitted energy measured is that confined within 5 degrees from the normal. The color of solutions changes with the thickness of the layer measured. Unless special considerations dictate otherwise, a layer 1 cm thick should be used.
The methods described here are not applicable to hazy liquids or translucent solids.
1.1 Calibration
For purposes of calibration, one of the following reference materials may be used, as required by instrument geometry. For transmittance measurements, purified water may be used as a white standard and assigned a transmittance of 1.000 at all wavelengths. Then the tristimulus values X, Y, and Z for CIE source C are 98.0, 100.0, and 118.1, respectively. For reflectance measurements, opaque porcelain plaques, whose calibration base is the perfect diffuse reflector and whose reflectance characteristics have been determined for the appropriate instrumental geometry, may be used.2 If the geometry of sample presentation precludes the use of such plaques, pressed barium sulfate, white reflectance standard grade, may be used. 3 After calibration with the above-mentioned materials, it is desirable whenever possible to measure a reference material as close to the color of the sample as possible. If a sample of the material being tested is not suitable for use as a long-term standard, color chips are available4 which span the entire visually uniform color space in small increments. The use of such a reference standard is encouraged as a means of monitoring instrument performance even for absolute color determinations.
1.2 Spectrophotometric Method
Determine the reflectance or transmittance from 380 to 770 nm at intervals of 10 nm. Express the result as a percentage, the maximum being 100.0. Calculate the tristimulus values X, Y, and Z as follows.
Reflecting materials
For reflecting materials the quantities X, Y, and Z are

is the spectral reflectance of the material, xλPλ, yλPλ, and zλPλ are known values associated with each Standard Source,1,2 and Δλ is expressed in nm.
Transmitting materials
For transmitting materials, the quantities X, Y, and Z are calculated as above, τ (spectral transmittance) being substituted for ρ .
1.3 Colorimetric Method
Operate a suitable colorimeter5 to obtain values equivalent to the tristimulus values, X, Y, and Z. The accuracy with which the results obtained from the filter colorimeter match the tristimulus values may be indicated by determining the tristimulus values of plaques of strongly saturated colors and comparing these values with those computed from spectral measurements on a spectrophotometer.
2 INTERPRETATION
2.1 Color Coordinates
The Color Coordinates, L*, a*, and b* are defined by
L* = 116(Y/Y )1⁄3 − 16,
a* = 500[(X/X )1⁄3 − (Y/Y )1⁄3], and
b* = 200[(Y/Y )1⁄3 − (Z/Z )1⁄3]
in which X , Y , and Z are the tristimulus values of the nominally white or colorless standard, and Y/Y > 0.01. Usually they are equal to the tristimulus values of the standard illuminant, with Y set equal to 100.0. In this case X = 98.0 and Z = 118.1.
2.2 Color Difference
The total Color Difference ΔE* is ΔE* = [(ΔL*)2 + (Δa*)2 + (Δb*)2]1⁄2
in which ΔL*, Δa*, and Δb* are the differences in color coordinates of the specimens being compared.
Instrumental variables can influence results. Although reliable comparisons can be made between similar colors measured concomitantly, results obtained on different instruments or under different operating conditions should be compared with caution. If it is necessary to compare data obtained from different instruments or taken at different times, etc., it is very helpful to have concomitant data obtained on a standard reference material such as color chips for opaque materials. Comparison of the readings on the reference material helps to identify variations caused by instrument performance.
1 Typical weighting factors are given by ASTM Z58.7.1-1951 as reported in the Journal of the Optical Society of America, Vol. 41, 1951, pages 431-439.
2 Suitable items are available from BYK-Gardner USA, 2431 Linden Lane, Silver Spring, MD 20910, or from Hunter Associates Laboratory, Inc., 11491 Sunset Hills Road, Reston, VA 22090.
3 Suitable material is available from Eastman Kodak Company, Rochester, NY 14650, as “White Reflectance Standard.”
4 Centroid Color Charts may be obtained from suppliers of instruments for measurement of color.
5 A suitable tristimulus colorimeter is available from BYK-Gardner USA, 2431 Linden Lane, Silver Spring, MD 20910, or from Hunter Associates Laboratory, Inc., 11491 Sunset Hills Road, Reston, VA 22090.
