ANALYTICAL PROCEDURE LIFE CYCLE
If you find any inaccurate information, please let us know by providing your feedback here

Tóm tắt nội dung
This article is compiled based on the United States Pharmacopeia (USP) – 2025 Edition
Issued and maintained by the United States Pharmacopeial Convention (USP)
DOWNLOAD PDF HERE
1 INTRODUCTION
This general chapter holistically considers the validation activities that take place across the entire life cycle of an analytical procedure and provides a framework for the implementation of the life cycle approach.
The analytical procedure life cycle approach described here is consistent with the quality by design concepts described in International Council for Harmonisation (ICH) guidelines. The procedure life cycle approach emphasizes the importance of sound scientific approaches and quality risk management for the development, control, establishment, and use of analytical procedures. Total error is used in this chapter; however, measurement uncertainty can also be used.
The procedure life cycle approach is applicable to all types of analytical procedures, and the extent of effort should be consistent with the complexity of the procedure and the criticality of the quality attribute to be measured. The life cycle approach can be considered optional, and any of the elements can be applied on the basis of how the procedure is used. Elements of the life cycle approach can also be applied retrospectively if deemed useful or in early stages of development with the appropriate modifications.
Elements of life cycle management of analytical procedures are also discussed in Analytical Procedures and Methods Validation for Drugs and Biologics (Guidance for Industry, FDA 2015).
Validation of an analytical procedure is the process by which it is established, through laboratory studies, that the performance of the procedure meets the requirements for the intended analytical applications. Validation, or demonstration that a procedure is suitable for the intended purpose, takes place during the entire procedure life cycle, beginning during the initial procedure design activities and extending through routine use. These activities include the formal procedure validation, verification, and transfer of procedures, as well as establishing and assuring adherence to an appropriate set of procedure controls and system suitability requirements.
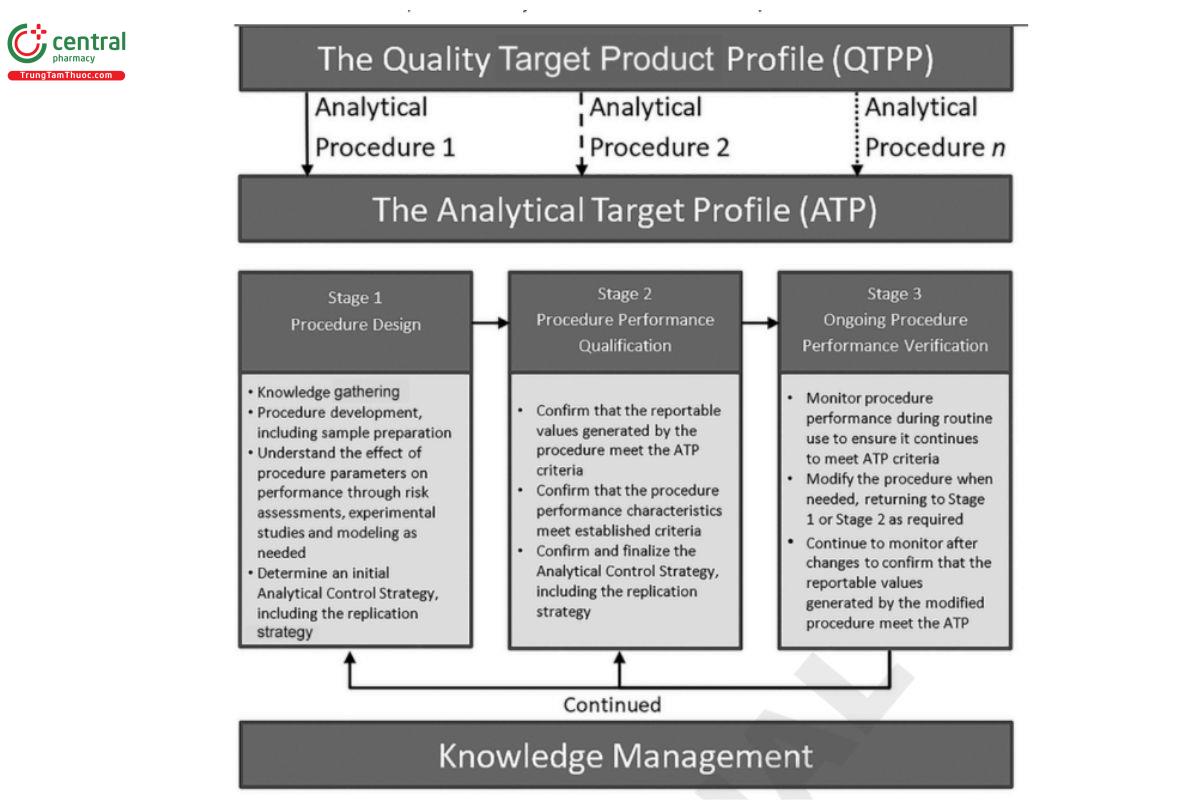
The procedure life cycle is comprised of the analytical target profile (ATP) and three stages, which are introduced below and shown in Figure 1.
The ATP defines the criteria for the procedure performance characteristics that are linked to the intended analytical application and the quality attribute to be measured. It applies to all stages of the procedure life cycle. For quantitative procedures, the ATP describes the required quality of the reportable value since the reportable value generated using a qualified analytical procedure provides the basis for key decisions regarding compliance of a test article with regulatory, compendial, and manufacturing limits. The acceptable level of risk of making an incorrect decision can also be considered when establishing ATP criteria.
Stage 1: Procedure design encompasses procedure development, which consists of the analytical technology and sample preparation. It includes understanding gained through knowledge gathering, systematic procedure development experiments, and risk assessments and associated lab experiments. The output of Stage 1 includes:
- A set of procedure conditions that minimizes procedure bias to a suitable level, can provide acceptable precision, and can meet the ATP criteria
- An understanding of the effect of procedure parameters (e.g., temperature, wavelength, flow rate, etc.) on procedure performance
- Optimization of performance characteristics of the analytical procedure such as accuracy, precision, the appropriateness of any calibration model, specificity and limit of quantitation (as far as applicable); this includes a preliminary replication strategy for samples and standards
- An initial analytical control strategy (ACS), which is a set of controls (system suitability tests [SSTs] and other procedure-specific controls) needed to ensure proper performance
Stage 2: Procedure performance qualification consists of studies designed to demonstrate that the procedure is suitable for its intended purpose. This involves confirmation that the reportable values generated by application of the analytical procedure meet the ATP criteria as well as confirmation of procedure performance characteristics through the traditional validation, verification, or transfer studies. Data generated during Stage 1 can be used if available and suitable. At the end of Stage 2, the replication strategy and the performance of the procedure is confirmed to meet the ATP and other criteria.
Stage 3: Ongoing procedure performance verification involves monitoring the analytical procedure during routine use and confirming that the performance continues to meet ATP criteria. Monitoring ensures that the performance of the procedure is maintained at an acceptable level over the procedure lifetime. It can also provide an early indication of potential performance issues or adverse trends and aid in identifying required changes for the analytical procedure. Confirming procedure performance after changes ensures that the modified procedure will produce reportable values that meet the criteria defined in the ATP.
More details about the procedure life cycle are described in the subsequent sections.
2 ANALYTICAL TARGET PROFILE (ATP)
A fundamental component of the life cycle approach is the definition of the analytical target profile (ATP) for the analytical measurement. The ATP is a prospective description of the desired performance of an analytical procedure that is used to measure a quality attribute, and it defines the required quality of the reportable value produced by the procedure, aligned with the quality target product profile (QTPP). The ATP is based on the intended use for the procedure and, for quantitative or semi-quantitative procedures, should include upper limits on the precision and accuracy (bias) of the reportable value. The ATP focuses the design goals for a new analytical procedure, serves as a basis for procedure qualification criteria, and provides a guide for monitoring of the procedure during its life cycle. Ideally, the ATP should be specified in way that is independent of the measurement technology; however, in some cases it may be necessary to link it directly to a measurement technology. The ATP can be defined in many ways, but the overall focus of having a procedure with acceptable bias and precision should be part of the ATP.
Some examples of ATPs are shown below. The first example has separate criteria for accuracy and precision.
Example 1: The procedure must be able to accurately quantify [drug] in a range from [A units] to [B units] in the [description of test article] in the presence of [x, y, z] with an accuracy = 100% ± [D%] and a precision ≤ [E%] for the reportable value.
The second example specifies that the combined accuracy and precision, or the distribution of the total analytical error (TAE), must fall within the desired level.
Example 2: The procedure must be able to quantify [analyte] in a range from [A units] to [B units] in the [description of test article] in the presence of [x, y, z] so that the distribution of the total analytical error of the reportable value falls within the total allowable analytical error range of ± [C%].
These two examples are not exhaustive and other approaches to defining an ATP can be utilized.
3 BIAS AND PRECISION
Procedure design, qualification, and performance verification often focus on specific procedure performance characteristics. For example, traditional procedure development is focused on achieving targets for accuracy, precision (repeatability and intermediate precision), detection/quantitation limit, and robustness. A close examination of these performance characteristics reveals that they focus on two primary aspects of the measurement:
- Bias (accuracy): how close the measurement is, on average, to the true value that is being measured
- Precision: how much the measurement will vary randomly under routine use
The link between specific procedure performance characteristics and the overall bias and precision should be considered during development. This can lead to a better understanding of the aspects that affect the bias and precision and to a better assessment and control of the risks associated with using the procedure.
Procedures should be developed to have levels of bias that are consistent with the ATP criteria, and the impact of bias on the reportable value should be considered. Appropriate limits for bias and precision in the ATP can be determined based on several factors, including:
- The criticality of the quality attribute being measured
- The risk that an unacceptable error could occur
- The width of the specification acceptance range for the quality attribute measured by the procedure
- The potential clinical safety or efficacy impact (if known) that an analytical error can have
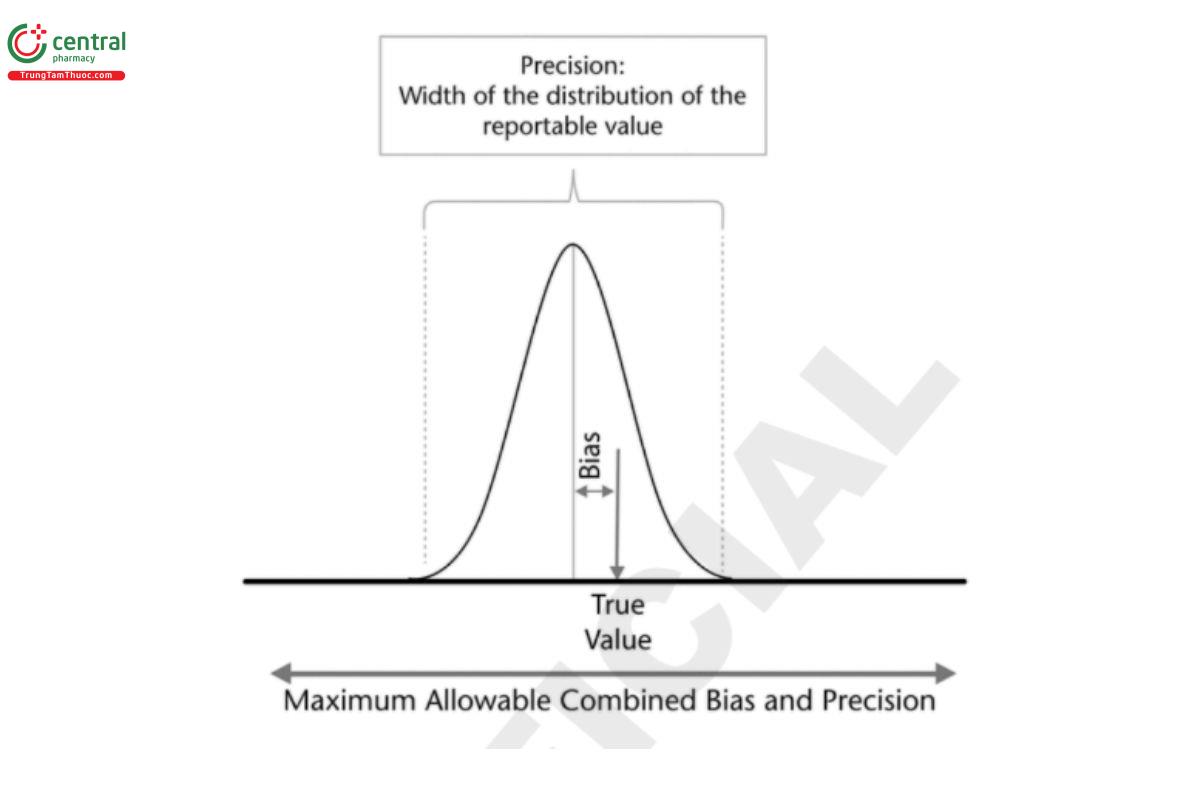
After considering those factors, a maximum allowable combined bias and precision can be determined that provides appropriate performance for the procedure (see Statistical Tools for Procedure Validation 〈1210〉). Once this has been determined, the distribution of the reportable value should be within that combined range. This approach expands the bias and precision into a combined range for likely values for the measurement (Figure 2).
4 SPECIFICATION AND DECISION RULES
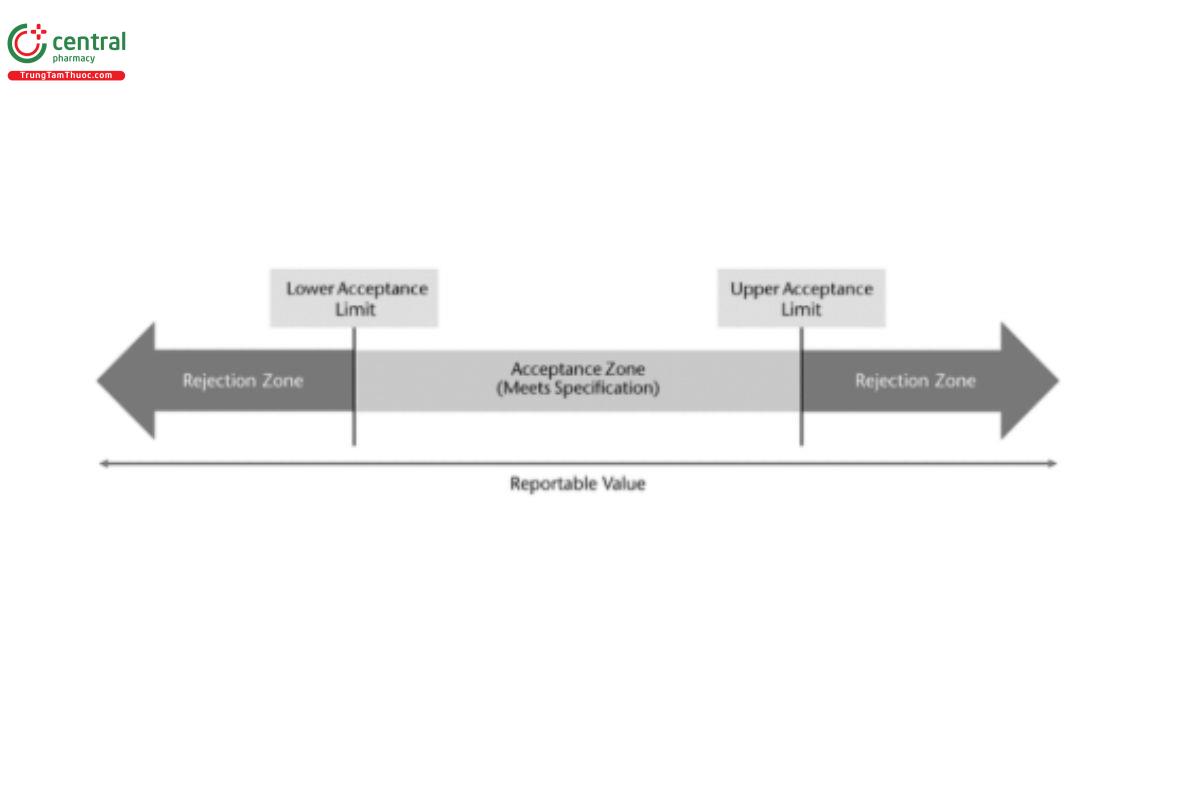
Deciding if a material conforms to specification relies on the use of a decision rule. A decision rule provides the acceptable level of the probability of making a wrong decision which can be used to define the maximum allowable combined bias and precision. There are several types of decision rules with the most common being the simple decision rule, where the material meets specification if the reportable value is within an acceptance range, and otherwise it does not meet specification (Figure 3).
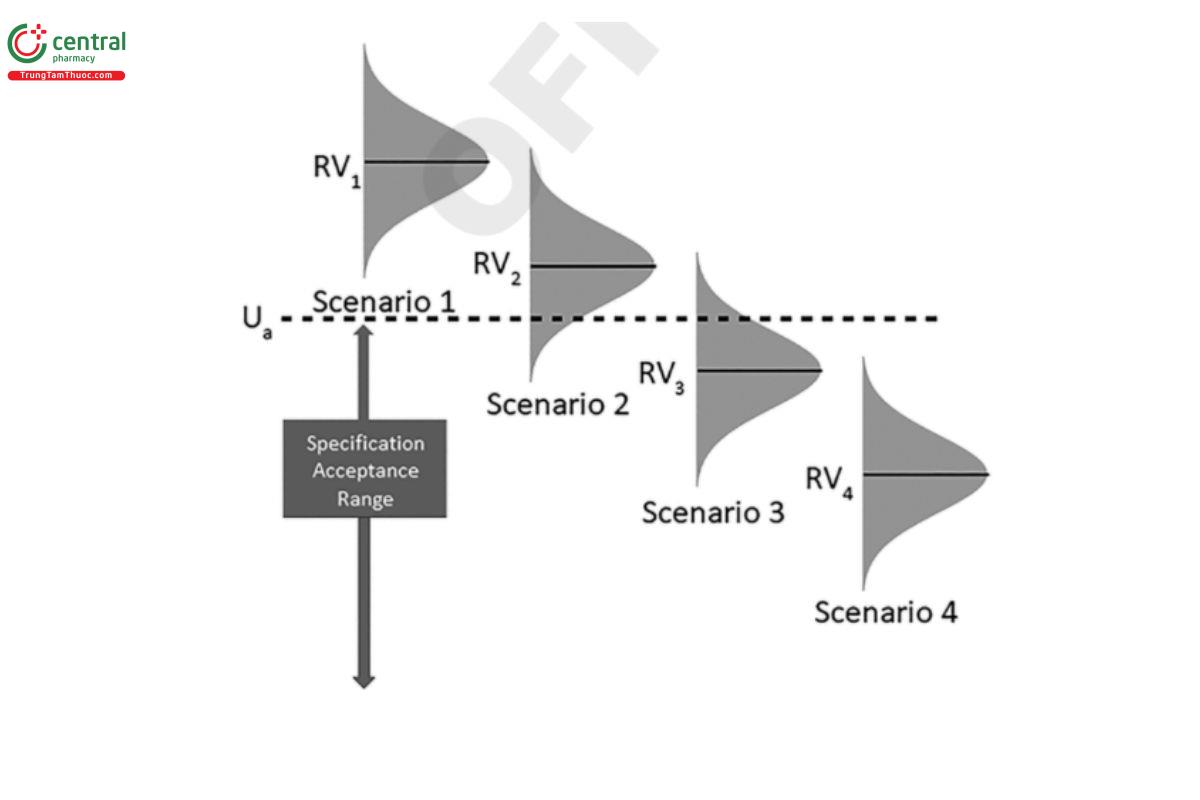
One consideration for determining the ATP criteria is understanding the impact that total analytical error has on the risk associated with the decision that a material conforms to specification. Total analytical error is used in this chapter; however, measurement uncertainty can also be used (see Analytical Data—Interpretation and Treatment 〈1010〉). The primary risk is that the decision rule produces the wrong decision; that is, that the material tested is determined to conform (or not conform) to specification limits when in fact the opposite is true. This risk may be strongly impacted by the procedure variability. The following are examples of risks associated with a specification that has an upper acceptance limit (Ua) under four scenarios (Figure 4):
Scenarios 1 and 4: In these scenarios, the decision is clear. The reportable value (RV1 and RV4) is well above or below the upper acceptance limit relative to the distribution of the total analytical error.
Scenarios 2 and 3: In these scenarios, it is less clear that the true quality characteristic is actually above or below the upper acceptance criterion and there is probability that the true value of the quality characteristic is actually inside (Scenario 2) or outside (Scenario 3) the specification acceptance range.
For Scenario 1 and Scenario 4, the simple decision rule produces an outcome with very low risk of making the wrong decision. However, for Scenario 2 and Scenario 3, the reportable value is close enough to the acceptance criterion to create some risk that the wrong decision could be made.
In all of these scenarios, what ultimately needs to be considered is the use of the material being tested and how the specifications are established. If the specification acceptance criteria are well within a safe and efficacious range, using the simple decision rule that the reportable value must be within the specification acceptance range provides adequate protection. However, the closer the acceptance range is to the safe and efficacious range, the larger the impact the distribution of the total analytical error can have on decision rule risks. Managing these risks may be achieved by altering the type of decision rule that is used.
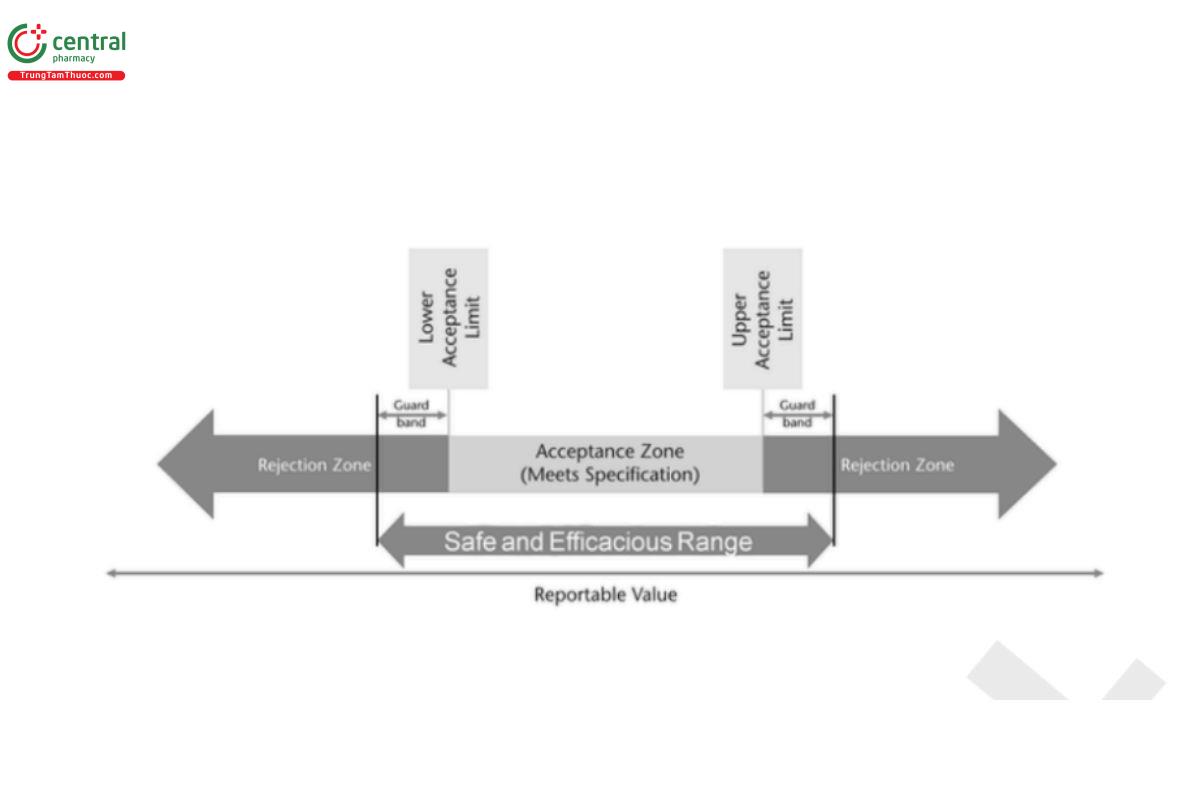
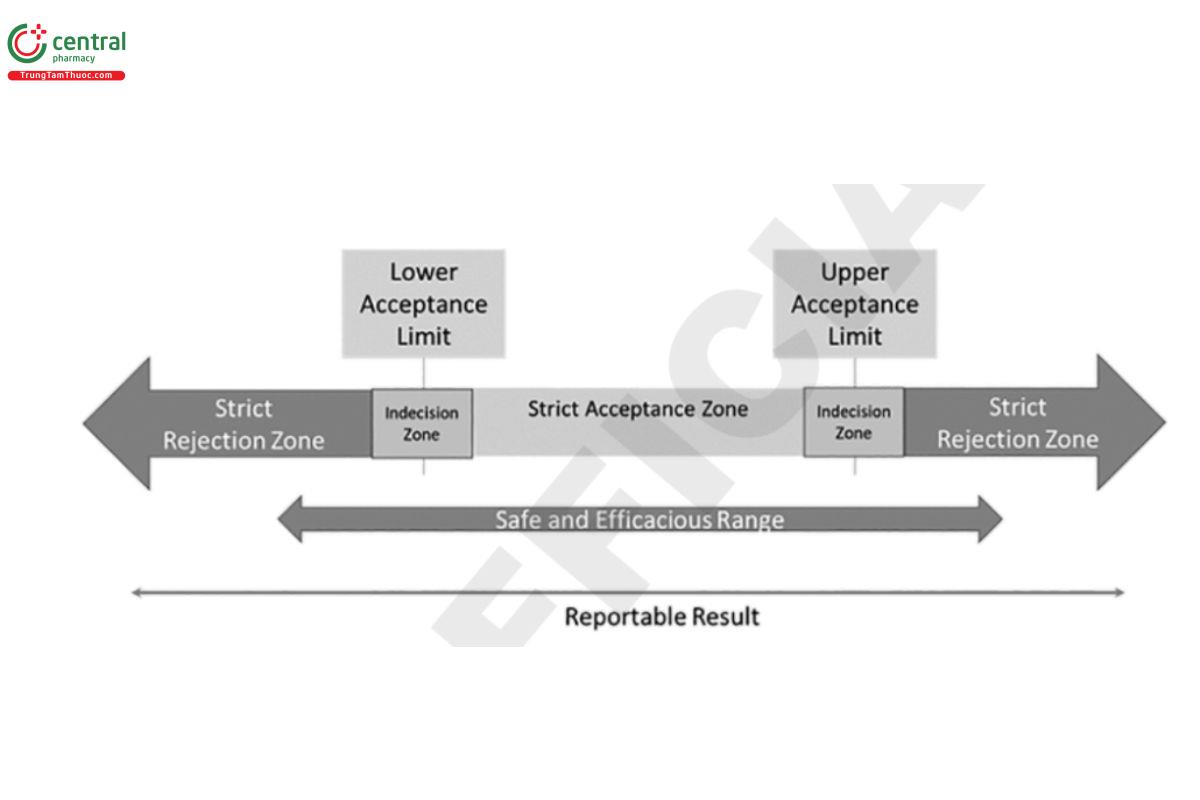
In the situation where the safe and efficacious range is accurately known, guard bands can be applied to that range, based on the distribution of the total analytical error, to determine the acceptance range (Figure 5). In situations where additional risk reduction is desired, a multistage testing approach could be used with an indecision zone (Figure 6 ) for the initial stage of testing. When the reportable value is within the indecision zone, a predetermined supplementary sampling and testing plan and decision rule are used to determine conformance.
5 STAGE 1: PROCEDURE DESIGN
5.1 Preparation for Analytical Procedure Development
When possible, ATPs should be established for quality attributes that require analysis and established before starting procedure design activities. Any technique that is capable of meeting the ATP criteria can be selected. Relevant prior knowledge can assist with the procedure development activities, which can include the physical and chemical properties of the analytes, information in the scientific literature, and any existing procedures for the analysis of the same material type or for similar material attributes. The availability of any relevant analytical technology and/or platform analytical procedures (applicable to materials of similar type) can also be considered, which may expedite procedure development activities.
- Once the technology has been selected, and if development of a new analytical procedure is required, relevant information should be gathered prior to conducting development activities. Such information may include:
- Known chemical structures and their physical and chemical properties Reference standards, reagents, likely instrumentation and systems
- Any other relevant information linked to the operational requirements, such as instrumentation type/setup and sample preparation
5.2 Analytical Procedure Development
The main purposes of procedure development are to identify conditions that minimize or avoid bias, to optimize variability, and to establish robust operating parameters that have the potential to meet the ATP. This can be carried out through the systematic screening and/or optimization of instrumental and sample preparation conditions when appropriate. This work begins with the process of understanding the influence of analytical procedure parameters on performance and their impact (directly or indirectly) on the ATP.
It is important to define the objective of development in terms of the desired levels of robustness to be achieved and the risks associated with the use of the procedure. This ultimately dictates the level of development needed in terms of the extent of experimentation and any modeling that may be used to optimize procedure performance.
The output of the procedure development process provides procedure operating conditions that represent the desired level of robustness.
5.3 Quality Risk Management (QRM) and the Analytical Procedure
QRM for an analytical procedure is a systematic process for the assessment, control, communication, and review of risk to the quality of the reportable value across the life cycle of the analytical procedure.
The aim of the QRM process is to assess the proposed procedure conditions and identify appropriate controls on the analytical procedure parameters and material attributes that will ensure the procedure meets the ATP. All variables associated with the analytical procedure should be considered, including sample and standard preparations, instrumental and equipment parameters, and environmental variables (e.g., laboratory temperature, humidity, etc.).
QRM activities can be applied during procedure development either formally or informally and major sources of bias and variability can be identified, reduced or even eliminated by ensuring the appropriate technology and procedure conditions.
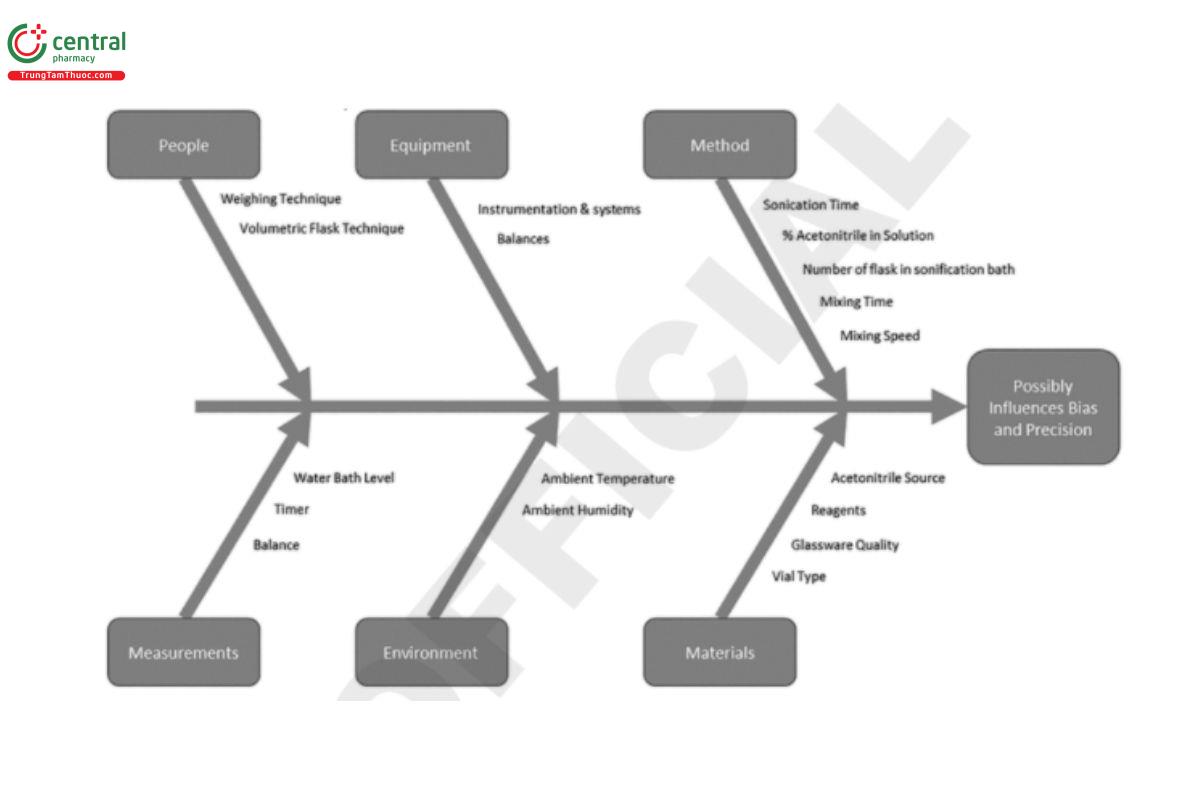
The first step in the QRM process is the risk assessment, which starts with risk identification. To facilitate risk identification, the analytical procedure can be described using a process flow, map, or summary, and each part of the procedure can be broken down into detailed sub-steps. It is important to consider all steps, from sample and standard preparation to analyte testing to quantitation. The procedure process map can then be used to identify variables associated with the analytical procedure. Tools such as Ishikawa diagrams can be used in conjunction with the process maps to identify potential variables associated with each step in the analytical procedure.
Prior knowledge related to the analytical technology can accelerate this step (e.g., generic Ishikawa diagrams and process maps may exist for common analytical techniques). Figure 7 illustrates a range of potential variables associated with the sample preparation step from an HPLC analysis.
Once potential variables have been identified, the risk associated with each variable can be estimated and ranked based on the ability to meet the ATP and other desired performance attributes. This assessment is driven by prior knowledge and scientific expertise, but some factors with unknown influence may need to be considered higher risk until further knowledge is available.
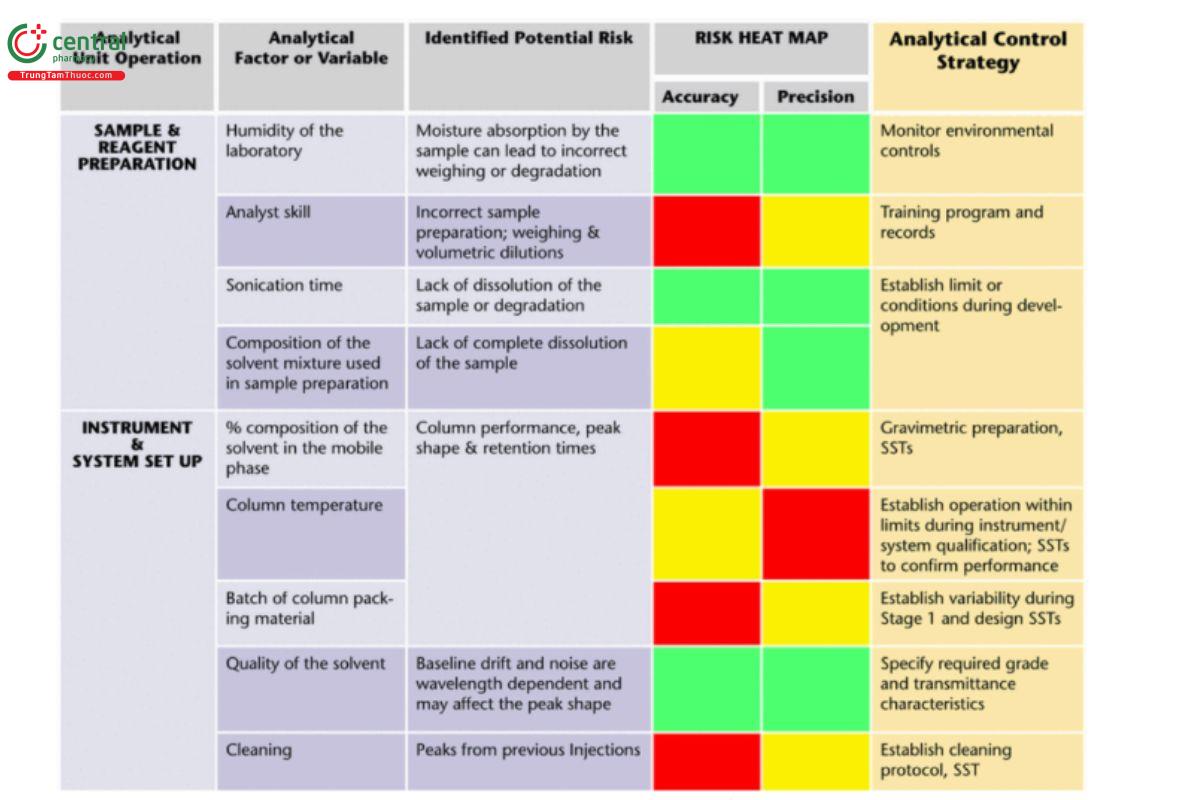
A heat map can be a valuable tool to support a qualitative assessment of risk. A heat map provides a visual indication of which variables are considered to have a potentially strong, medium, or minor impact on the performance of the analytical procedure (see Table 1).
Table 1. Example of heat map capturing a qualitative risk assessment related to sample preparation and HPLC setup steps from an analytical procedure. Impact levels are strong (red), medium (amber), and minor (green).
Alternatively, each risk can be formally scored and ranked using set risk criteria, for example using failure mode and effects analysis (FMEA).
Once the risk associated with each factor and variable has been determined, planning for how to manage those risks occurs. The risk for those variables that are well understood may be mitigated by controlling them within a certain range (control variables). Other variables will be difficult or impractical to control, and the risks associated with them will need to be accepted (noise variables). For variables where there may be higher risk, one way to reduce risk is to gain additional knowledge about the influence of those parameters using modeling and/or experimentation.
Experimentation is a direct way of generating data that can be used to assess the impact of procedure parameters on performance, and the use of statistical design of experiments (DOE) is an effective way to do this. This approach is generally useful for exploring procedure parameters and optimizing the conditions of the procedure to obtain the desired performance. In a well-designed experiment, the way data are collected ensures that the effect of variables and their possible interactions on the quality attributes are studied.
Specific recommendations on the types of DOEs to use are outside of the scope of this chapter; however, a design that examines combinations of factors and their possible interactions usually can better predict procedure performance compared to one-factor-at-a- time designs.
When available, mechanistic models can be used to understand the effect of procedure parameters on performance. Use of mechanistic models can reduce experimental work and provide a reliable estimate of the behavior of the analytes of interest.
Some procedures may not require modeling, for example if the technology is simple or if the overall risk of not meeting the ATP is low.
There are different modeling approaches that can be applied, including empirical and mechanistic, and either may be appropriate depending on the intended use of the analytical procedure and the desired model accuracy.
5.4 Robustness and Method Operable Design Region (MODR)
Robustness is a measure of the capacity of a procedure to remain unaffected by small but deliberate variations in parameters and to maintain suitability during normal usage. In some cases, it is helpful to demonstrate robustness of the procedure by developing models that describe the effect of parameters on the performance of the procedure, either through assessing performance against the ATP or other surrogate criteria. This knowledge also enables the determination of robust operation regions for procedure parameters and, if desired, a method operable design region (MODR).
The MODR is the multivariate space of analytical procedure parameters that ensure the ATP is fulfilled and therefore provide assurance of the quality of the measured value. The MODR should ideally be obtained through well-designed experiments that consider multivariate interactions. If the MODR relates to attributes that are linked to the elimination of bias (such as ensuring appropriate separation in chromatographic procedures) or minimization of variability (through operating at a suitable λmax wavelength), an impact on the final performance of the reportable value is not expected. Consequently, the validation performance characteristics do not need to be investigated completely within the MODR. When there are a number of noise factors associated with an analytical procedure, performance can vary over time among laboratories or instruments or other noise factors. In these cases, the MODR reflects the knowledge at a point in time and can be managed by the analytical life cycle (see Stage 3).
5.5 Replication Strategy for the Reportable Value
Once the target conditions and operating ranges for the procedure have been determined, an assessment can be performed to develop an understanding of the overall sources of variation contributed by the procedure. This can be accomplished in many ways, including propagation of error models and measurement system analysis experiments. Sources of variation may be grouped into general categories such as run-to-run and within-run variations. Those sources could also be broken down into component categories such as lab-to-lab, instrument-to-instrument, sample preparation, and sample introduction. If the amount of variation from these sources can be quantified, it may allow for the use of an optimized sample and standard replication strategy.
In general, replicating the aspects of the procedure that contribute to a large part of the overall variation followed by an appropriate analysis to generate the reportable value will lead to improved precision. Estimating the amount of variation associated with each step of the procedure during the procedure design phase can allow for determination of an optimal sample and standard replication strategy, which may enable the procedure to more easily meet the criteria of the ATP for the reportable value. Consideration should be given to including the acceptable variability among the individual results for the factors (e.g. sample preparation, sample injection etc.) being replicated in system suitability criteria (see Figure 8 for an example of such a criterion).
5.6 Analytical Control Strategy (ACS)
The ACS is a set of controls needed to ensure the procedure performs as expected and plays a key role in ensuring that the ATP is realized throughout the life cycle. The preliminary ACS is identified during the procedure development process in Stage 1 and includes SSTs and other environmental or procedure controls needed for the procedure to meet the ATP. It is derived from an understanding of the analytical procedure as a process and the requirements defined in the ATP. Critical procedure attributes, identified during development, should be controlled, and their acceptable conditions, materials, or criteria should be explicitly specified in the procedure.
The analytical procedure with its associated initial control strategy is the input to Stage 2 of the life cycle.
6 STAGE 2: ANALYTICAL PROCEDURE PERFORMANCE QUALIFICATION (APPQ)
Stage 2 involves confirming (or qualifying) that the procedure meets the requirements of the ATP in the facility where the procedure will be routinely operated. This qualification activity takes place once the initial ACS has been defined.
The elements of Stage 1 described above establish the analytical procedure, preliminary ACS, and replication strategy and conclude the initial development activities. Once the procedure is established, the procedure is ready to undergo analytical procedure performance qualification (APPQ). APPQ occurs in Stage 2 of the life cycle and evaluates the procedure to determine if it is capable of consistently generating a reportable value that meets the defined ATP and is suitable for its intended purpose in the laboratory. APPQ is a term inspired by the FDA Guidance for Industry Process Validation: General Principles and Practices in which PPQ is used for process performance qualification that confirms the commercial manufacturing process design and performance is as expected. Here, APPQ encompasses all of the analytical procedure activities commonly referred to as qualification, verification, validation, and transfer described in other literature and guidances. This chapter expands these well-known activities to integrate them into the procedure life cycle and include them in a process that incorporates the ATP.
6.1 Protocol and Study Design
APPQ is an important milestone in the analytical life cycle and is thus a documented activity under protocol. The extent of the APPQ study design depends on several factors including the type of technology of the procedure being qualified.
The protocol for a qualification study generally includes (but is not limited to):
- The ATP.
- The acceptance criteria needed to meet the ATP (e.g., accuracy, precision, range) and procedure-specific performance characteristics (e.g., specificity, calibration model, quantitation limit). Also refer to other appropriate guidance related to procedure validation, verification, or transfer. Depending on the data collected in Stage 1, it may be appropriate to include by reference instead of repeating the experiment.
- A description of (or reference to) the procedure and its initial analytical procedure controls, including system suitability requirements.
- A description of the qualification experiments that will be performed and the statistical approach to be used to analyze the data. If appropriate, the experimental design can include varying noise factors in order to demonstrate acceptable performance under routine use.
- Acceptable performance and robustness under routine use.
- References to platform, universal, and general procedures that cross multiple products and analytes that may allow for reduced experiments based on previous qualification studies.
- Reference to data generated during Stage 1 that will be used to demonstrate qualification (e.g., robustness).
6.2 APPQ Results and Documentation
Upon successful completion of the qualification study, an evaluation should be performed to determine if the relevant analysis meets the criteria outlined in the ACS, including system suitability criteria, defined in Stage 1. Additional controls or modification to system suitability criteria may be included to reduce sources of variability that are identified in the routine operating environment.
When the qualification experiments are complete and the results meet the predefined acceptance criteria and are justified to be acceptable, the study is documented in a report. The report summarizes the protocol study design and ATP, presents the data and calculation results, and draws conclusions about the procedure’s suitability for intended use.
If the study did not meet predefined acceptance criteria, it may be appropriate to return to Stage 1 and perform additional procedure development activities before re-entering Stage 2. Stage 2 may also be reinitiated when significant changes to the analytical procedure operating conditions are needed or if there is a need to update the ATP.
Analytical procedure transfer as well as verification of compendial procedures fall under Stage 2 and are governed by the same documentation descriptions above. The extent of the study design for these activities should be based on the ATP and on an assessment of the risks to the procedure performance when a procedure is transferred or a compendial procedure is adopted.
The last steps in Stage 2 are to finalize the documented procedure (including learnings from the APPQ) and to finalize the ACS. The replication levels (multiple sample and standard preparations, multiple injections, etc.) may be updated based on the precision of the reportable value found during the qualification. The impact of changing the replication strategy must consider its continued ability to meet the ATP.
After the completion of the Stage 2 activities, the procedure is released for routine use; that is, it may be utilized for its intended purpose for testing.
7 STAGE 3: ONGOING PROCEDURE PERFORMANCE VERIFICATION (OPPV)
Stage 3 of the procedure life cycle ensures that the analytical procedure remains in control during routine use and thus continues to meet the ATP criteria.
This stage includes both routine monitoring of data linked to the performance of the analytical procedure and evaluation of the procedure's performance after changes to determine if the analytical procedure continues to be fit for purpose. Since a large number of analyses may be performed over time during the application of the analytical procedure, the monitoring provides an excellent opportunity to obtain reliable performance data during the routine application. This in turn provides the opportunity to identify unusual behavior and lack of expected performance.
7.1 Routine Monitoring
Effective monitoring of an analytical procedure provides ongoing confidence that the reportable values generated are fit for purpose. This stage includes an ongoing program to collect and analyze data that relate to analytical procedure performance. Monitoring may include tracking analytical performance attributes such as SSTs including SST failures, batch data trends including analytically caused out-of-specification or out-of-trend results, trends, and other attributes as appropriate. The extent of monitoring should be based on the risk associated with the respective quality attribute and with the analytical procedure. The monitored data and information should be evaluated periodically depending on the number of analyses performed. If there is an indication that the procedure is not in control, an investigation should be conducted and corrective and preventive actions taken.
7.2 Analytical Control Attributes
Data related to procedure performance can be extracted from the application of the analytical procedure itself or from additional analyses of control samples. Control samples can be those that are identical to or representative of the samples to be analyzed, a standard check result, or a standard addition to the sample. Such additional controls may be implemented on a risk basis, i.e., for complex procedures, or if indicated by performance failures in the monitoring program.
The ACS can be used as a source for identifying the relevant attributes used for ongoing monitoring, for example SST attributes such as system precision, signal-to-noise ratio, or peak symmetry. Operational attributes that are not directly linked to the ATP may not be well suited for the performance monitoring program. However, monitoring of such attributes, e.g., HPLC peak resolution or peak symmetry, may still provide benefits to proactively determine required activities, such as HPLC column replacement.
Direct monitoring of the reportable value with comparison to the ATP is best performed by analyzing control samples that are adequately representative of the test samples. As an alternate option, batch reportable values may be directly monitored. Although these values are comprised of both process- and analytical procedure-related variability, assessing their control charts allows the detection of changes and trends. Further investigations would be required to understand the cause, whether process or procedure related.
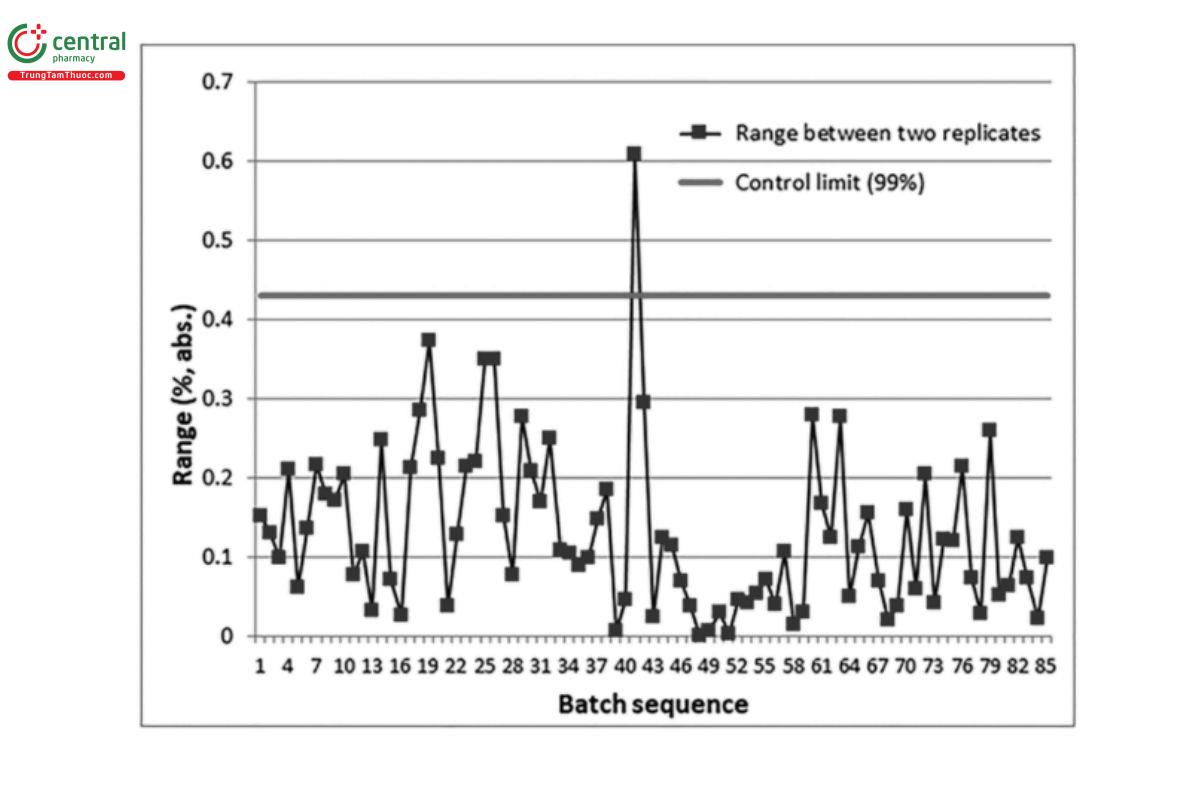
7.3 Control Charts
The use of control charts is a recommended practice for monitoring of procedure performance attributes and control sample results. A control chart is a plot of a response variable versus time with limits that are based on the distribution of expected values around a mean or target value (Figure 8). This approach is based on the premise that, no matter how well a procedure is designed, there exists a certain amount of natural variability in measurements. When the variation is due to random causes alone, the procedure is said to be statistically in-control, and values on the chart should generally stay within the control chart limits.
Control chart limits can be established to detect the presence of special causes of variation, sudden process shift, longer term drift, or excessive noise. When special cause variation is detected, an investigation can be conducted to determine the root cause and appropriate corrective actions.
In addition to the monitoring of these analytical control attributes, average (pooled) performance attributes can be calculated, such as an average standard deviation, a standard deviation from duplicates, or precision of the reportable value from control samples.
Monitoring analytical control attributes over time provides data that can be used for improved understanding of the true variation of components of the procedure and the overall procedure variation. This improved understanding can be valuable for determining necessary improvements to the procedure and for improving the ACS.
7.4 Changes to an Analytical Procedure
Changes to analytical procedures may be needed over the life cycle and can be prompted by several events including needed changes identified through a routine monitoring program, the adoption of new technology, or changes to the ATP. Such changes should be risk assessed for their impact to determine the appropriate activities required. In addition, appropriate change management approaches and documentation should be used when making changes to a procedure.
Depending on the degree of change made to the analytical procedure, the actions required to confirm the performance after the change will vary. The level of activities required to confirm that a changed analytical procedure is producing fit-for-purpose data will depend on an assessment of the risk associated with the change, the knowledge available about the procedure, and the effectiveness of the ACS.
Examples of change
- An adjustment to a procedure parameter to a value within the range that was previously qualified (e.g., a change within the MODR) may not require additional experimentation before implementation. However, any changes to the routine operating conditions within the MODR should be risk assessed against the ability to meet the ATP criteria and further studies performed as needed prior to implementation of the new operating conditions. An adjustment of the established monitoring limits also might be required.
- A change to a procedure variable to a value outside the set point or range that was previously qualified would require a risk assessment, which should consider the procedure performance characteristics that may be impacted by the change. These performance characteristics should then be considered in a PPQ study to confirm that the change does not impact the procedure's ability to meet the ATP.
- A change to a new laboratory (i.e., analytical transfer) would require review of the risk assessment and appropriate qualification activities to ensure that the implemented procedure meets the ATP requirements.
- A change to a new procedure/technique would require new or additional appropriate design and qualification activities (Stage 1 and Stage 2) to demonstrate conformance of the new procedure to the ATP.
- A change impacting the ATP, e.g., a specification acceptance limit change, would require a new ATP and review of the existing procedure design and qualification data (Stage 1 and Stage 2) to determine whether the procedure will still meet the requirements of the new ATP.
8 GLOSSARY
Analytical Control Strategy (ACS): A planned set of controls derived from current analytical procedure understanding that ensures the analytical procedure performance and the quality of the measured results and reportable value.
Analytical Procedure Performance Qualification (APPQ): General term for all activities performed in Stage 2 of the Analytical Procedure Life Cycle, i.e., to demonstrate that the procedure is suitable for routine application in the respective laboratory. This may include ICH validation, verification of compendial procedures, or transfer. [NOTE—Other definitions are also used for qualification of biological procedures, reference materials, and instrument qualification.]
Analytical Procedure Validation: All activities that confirm that a procedure is suitable for the intended purpose that take place over the entire life of the procedure. [NOTE—This interpretation is broader and more holistic than those in ICH. Within the context of the ICH Q2- Guidline, validation activities expected for a submission application are described. These activities take place in the lifecycle Stage 2, which also includes verification of compendial procedures, and analytical transfer.]
Analytical Target Profile (ATP): The ATP defines the required quality of the reportable value and is a description of the criteria for the procedure performance characteristics that are linked to the intended analytical application and the quality attribute to be measured. Bias: Estimate of a systematic measurement error.
Fit for purpose: Demonstration of meeting the intended use as specified in the ATP through the analytical procedure lifecycle. Measurement Uncertainty: A parameter associated with the result of a measurement, that characterizes the dispersion of the values that could reasonably be attributed to the measurand.1
Method Operable Design Region (MODR): A combination of analytical procedure parameter ranges within which the analytical procedure performance criteria are fulfilled and the quality of the measured result is assured.
Ongoing Procedure Performance Verification (OPPV): General term for all activities performed in Stage 3 of the Analytical Procedure Life Cycle. Assurance that an analytical procedure remains suitable during the routine application by verification of its ongoing suitability after changes, and by monitoring of performance parameters to identify potential performance changes or adverse trends.
Platform analytical procedure: A platform analytical procedure can be defined as a multi-product method suitable to test quality attributes of different products without significant change to its operational conditions, system suitability, and reporting structure. This type of method would apply to molecules that are sufficiently alike with respect to the attributes that the platform method is intended to measure.
Quality Risk Management (QRM): A systematic process for the assessment, control, communication and review of risks to the quality of the analytical procedure over the product lifecycle.
Reportable Value: The reportable value is the end result of a completed measurement procedure, as documented. The reportable value, which often is a summary value for several individual determinations, is compared with the acceptance criteria (see General Notices 7.10 Interpretation of Requirements).
Total analytical error (TAE): Total analytical error (TAE) represents the overall error in a test result that is attributed to imprecision and inaccuracy; TAE is the combination of both systematic error of the procedure and random measurement error.
Transfer of analytical procedures (TAP): Documented process that qualifies a laboratory (the receiving unit) to use an analytical test procedure that originated in another laboratory (the transferring unit), thus ensuring that the receiving unit has the procedural knowledge and ability to perform the transferred analytical procedure as intended (USP 〈1224〉).
Verification of compendial procedures: Documented assessment of whether the compendial procedure can be used for its intended purpose, under the actual conditions of use for a specified drug substance and/or drug product matrix (USP 〈 1226〉). (USP 1-May-2022)
1 USP PF 44(1) Measurement Uncertainty for the Pharmaceutical Industry.
