ANALYTICAL METHODOLOGIES BASED ON SCATTERING PHENOMENA—NEPHELOMETRY AND TURBIDIMETRY
If you find any inaccurate information, please let us know by providing your feedback here

Tóm tắt nội dung
This article is compiled based on the United States Pharmacopeia (USP) – 2025 Edition
Issued and maintained by the United States Pharmacopeial Convention (USP)
1 1. INTRODUCTION
Nephelometry and turbidimetry are based on the direct (nephelometry) or indirect (turbidimetry) measurement of the scattered light intensity of an incident light beam from a monochromatic light source. In the rate nephelometry technique, the change of the scattered light intensity is measured as a function of time. Turbidimetry or nephelometry may be useful for the measurement of precipitates formed by the interaction of highly dilute solutions of reagents or other particulate matter such as suspensions of bacterial cells. All variables must be carefully controlled to achieve consistent results. Where such control is possible, extremely dilute suspensions may be measured.
2 2. THEORY
2.1 Nephelometry and Turbidimetry
For all relevant terms and definitions see Nephelometry and Turbidimetry 〈855〉. Both techniques are governed by the same equation, which describes the (time-averaged) intensity of the light beam as it interacts with matter along its path, i.e., when the incident light detected at an angle of zero decreases exponentially with the thickness, x, of the layer of material. See Equation 1.
I = I₀ e^(−τx) (1)
2.2 Rate Nephelometry
As discussed above, the scattered light intensity when a sample is submitted to a constant incident monochromatic light beam depends on the number and size of the particles that scatter the light. If either or both of these factors change over time as a result of a chemical or physical process, the cumulative scattered light intensity at a given direction (usually 90° to the incident light direction) will change accordingly. Thus, rate nephelometry measures the change, or rate of change, in the intensity of light scattered during the formation of complexes (e.g., antigen-antibody) in solution. A correlation between the physicochemical changes and the scattered light intensity can be established and used to evaluate the property changes in the samples under test.
The extent of formation of light scattering complexes depends on concentrations of complex formation entities, e.g., antibodies and antigen molecules for immunonephelometry. The maximum rate response occurs when the antibody and antigen are in optimal proportions. Generally a fixed amount of antibody is used. Standard applications typically use 670-nm lasers with the detector aligned at 90° to the incident light direction, and the scattered signal is measured at 5-s intervals. System software calculates the rate of change at the end of reaction. The rate of change is converted to concentration by the system software.
2.3 Rate Turbidimetry
Rate turbidimetric methods measure the decrease in intensity of light as it passes through a solution while complexes form. The light source is a light emitting diode (LED) at 940 nm. Turbidimetric measurements are made at 0° from the incident beam. The intensity decrease is converted to an increasing scatter signal by Equation 2.
.jpg)
3 3. INSTRUMENTATION
A schematic diagram and principles of operation of a nephelometric (turbidimetric) instrument are shown in Nephelometry and Turbidimetry 〈855〉, Figure 1.
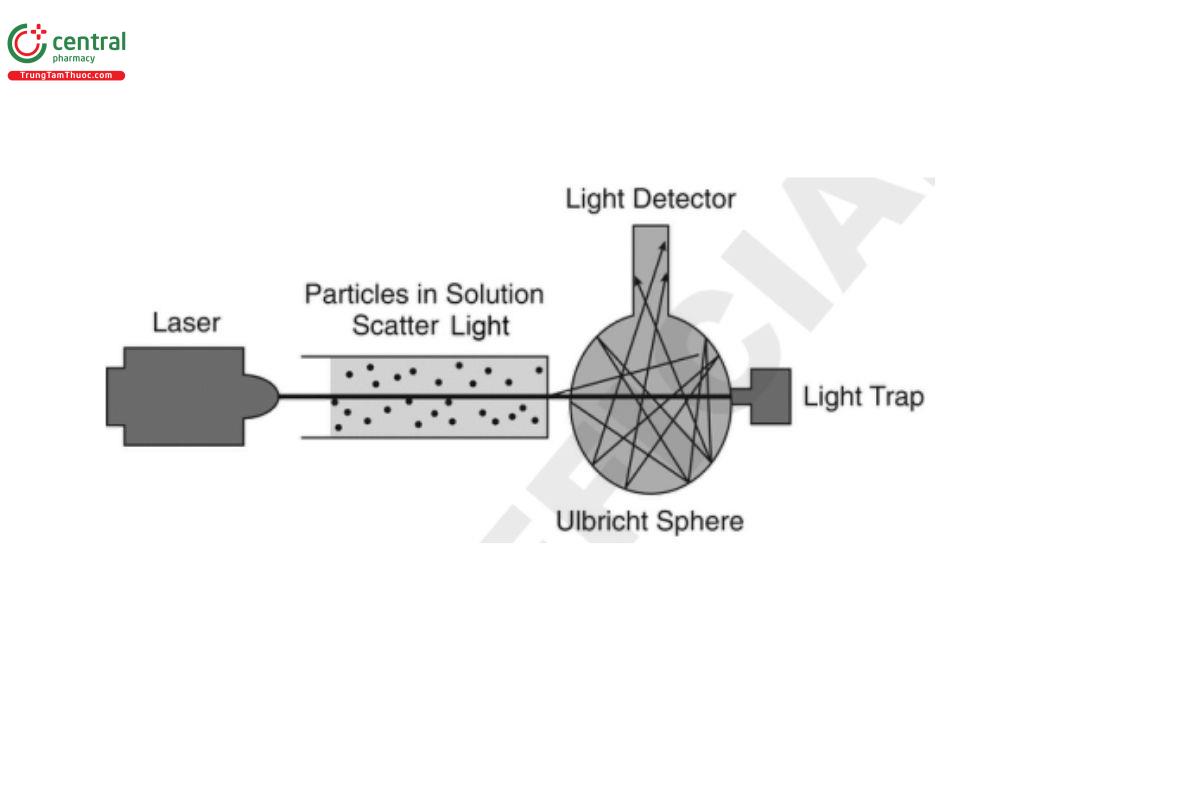
The main components are:
• a light source that is usually a laser (635 nm) with a highly collimated beam to avoid stray light
• a sample cell
• a light detector
The laser beam passes through the sample well into a scattered light detector assembly. Typically an integrating sphere (Ulbricht sphere), which helps improve the signal-to-noise ratio and enhance the signal for very low concentrations, is attached to a photodiode and used as the detector in rate nephelometry instruments.
The unscattered light (light not deflected by particles) passes straight through the sphere and no signal is generated. Light scattered by particles is reflected around the interior of the sphere and then detected by the photodiode detector.
The angle of detection of the scattered light is usually 90°, which is suitable for smaller aggregates (d ≤ λ/20).
A light trap is attached to the Ulbricht sphere at the opposite side of the light beam entrance window to absorb the unscattered light.
The amount of scattered light is proportional to the concentration of particles.
Some instruments can perform both rate nephelometry and rate turbidimetry measurements. These instruments are equipped with:
• a laser source at 670 nm with 90° scatter detection for nephelometric measurements
• an LED source at 940 nm with 0° scatter detection for turbidimetric measurements
3.1 Rate Nephelometry Instrumental Parameter Settings
The most important rate nephelometric system parameter settings are:
Acquisition time:
Reaction cuvettes, housed on a reaction wheel, are scanned in cycles of 5 s, for total reaction times ranging from 1.5 to 10 min. Acquisition time commences upon completion of a 5-min preset baseline acquisition period, also in 5-s cycles. Most reactions in nephelometric applications achieve peak rates within 2 min, whereas those used in turbidimetric applications require longer reaction times (3 min or longer).
Gain settings:
These settings are related to signal amplification. Generally, decreasing analyte concentration requires a concomitant increase in gain to maintain sensitivity.
Onboard compartment temperatures:
Reaction wheel temperature is maintained at 37° to enhance aggregate formation. The reagent compartment is cooled to extend stability of antibody reagents, whereas the sample compartment temperature is ambient.
Laser beam width and intensity adjustment:
If applicable, the laser beam width and intensity are adjustable in some instruments and can be optimized to obtain the best scattered signal response.
3.2 Calibration of Rate Nephelometric Instruments
Calibration of the rate nephelometer is typically a multitier process consisting of preprogrammed and user-defined components.
The preprogrammed component is executed with each instrument run and is comprised of measurements of an onboard reference cuvette of known scatter values.
The user-defined component relies on protein controls. Certified protein controls are routinely used for initial instrument calibration and may be utilized for periodic instrument performance qualification.
For method calibration and performance monitoring, specially formulated product-relevant reference materials are used.
Data assessment is accomplished by comparison against the control manufacturer’s published range, peer data, and/or internally established acceptance criteria.
Each analytical run typically includes:
• a calibration curve of reference material
• where applicable, a single concentration of control
Each is selected to represent the product of interest.
The validity of an instrument run is dependent on satisfaction of acceptance criteria established through method development and statistical analysis of temporal method performance.
4 4. APPLICATIONS
〈855〉 gives a general overview of the applications of turbidimetric and nephelometric techniques including the rate nephelometry and rate turbidimetry.
The following discussions represent additional and more detailed information on the applications of rate nephelometry and rate turbidimetry in the biopharmaceutical industry and clinical laboratories, summarized in Table 1.
In bacterial polysaccharide-containing vaccine analysis applications, the reaction of excess of monoclonal or polyclonal antibodies with high molecular weight bacterial polysaccharides causes crosslinking and formation of aggregates that scatter light.
Examples include polysaccharides from:
• *Haemophilus influenzae* type b
• *Neisseria meningitidis*
• *Streptococcus pneumoniae*
The rate at which aggregates develop allows the polysaccharides, free or conjugated, to be quantified.
Endpoint nephelometry is an alternative application in which the endpoint of the reaction is determined in the analysis.
In multivalent vaccines, antibody specificity allows selective detection and quantification of a specific polysaccharide.
Immunonephelometry for biologics analysis is based on antibody-antigen immune complex formation.
Quantitative methods rely on constant antibody excess where immunoprecipitation increases with increasing antigen content.
Applications include characterization, monitoring of functional group content, stability, and assessment of lot-to-lot consistency.
Examples of vaccine components analyzed include:
a) bulk monovalent glycoconjugate immunogens
b) bulk polyvalent glycoconjugate immunogen blends
c) bulk polyvalent polysaccharide blends
d) glycoconjugate vaccine final fills
e) polysaccharide vaccine final fills
Turbidimetry is widely used for measurement of activity in recombinant coagulation factor and other hemophilia replacement therapies and for patient monitoring in clinical hemostasis laboratories.
Table 1. Examples of Analytical Applications
Turbidimetry | Nephelometry
Immunoagglutination assay: detection of Chagas disease | Polysaccharide quantitation: pneumococcal vaccine
Multiple latex immunoagglutination assays | Polysaccharide quantitation: meningococcal vaccine
Fibrinogen assays | Relative molecular size (nephelometry coupled with high pressure size exclusion chromatography)
5 5. METHOD DEVELOPMENT
Thorough method development encompasses designing the method to fit the application through assessing a complex set of conditions including choice of reagents, standards, controls, sample handling, and instrument settings.
The following areas should be considered during method development to determine operating ranges and limits.
5.1 Method Design
Competitive versus noncompetitive assay modes are available.
The option chosen will be dictated by sample molecular weight/size and analyte concentration.
Noncompetitive immunoprecipitation mode is preferred for MW > 10⁴ Da.
Sample concentration directs the selection of instrument gain.
Lower concentrations require higher gain levels.
A response curve between analyte concentration and measured light scattering unit (LSU) values is prepared from standard solutions.
The standard curve is evaluated using appropriate statistical methods such as least-squares regression.
5.2 Sample Considerations
Samples must be free from particulates and air bubbles to minimize nonspecific light scattering and sensing errors.
Samples containing adjuvants may require solubilization under controlled conditions.
Pretreatments may include:
• pH adjustment
• adsorption with excess adjuvant
• temperature treatment
• centrifugation
5.3 Reagents
Reaction buffer selection depends on compatibility with the analyte formulation buffer.
Detergent may be required for certain analytes.
Polyclonal antibodies are preferred for rate nephelometry, although monoclonal antibodies may be required for specific functional group detection.
5.4 Method Specific Reference Standards
Reference materials are selected from process-representative batches and formulated to mimic the analyte of interest.
5.5 Controls
Positive and negative controls are selected as product-representative materials and may be stabilized by freezing or lyophilization.
5.6 Robustness
Robustness studies may include evaluation of:
• instrument gain
• reaction time
• antigen concentration
• antibody concentration
• mixing times
• antibody selectivity
• reagent hold time
• ionic strength of solution
6 6. METHOD VALIDATION
In addition to validation characteristics described in Validation of Compendial Procedures 〈1225〉, the following should be considered:
Accuracy
Linearity
Lifecycle considerations
System suitability
7 7. DATA ANALYSIS
A calibration curve is generated from duplicate readings of reference standards versus concentration.
Percent difference between duplicate readings for standards, controls, and samples is calculated.
Antigenicity is calculated using Equation 3:
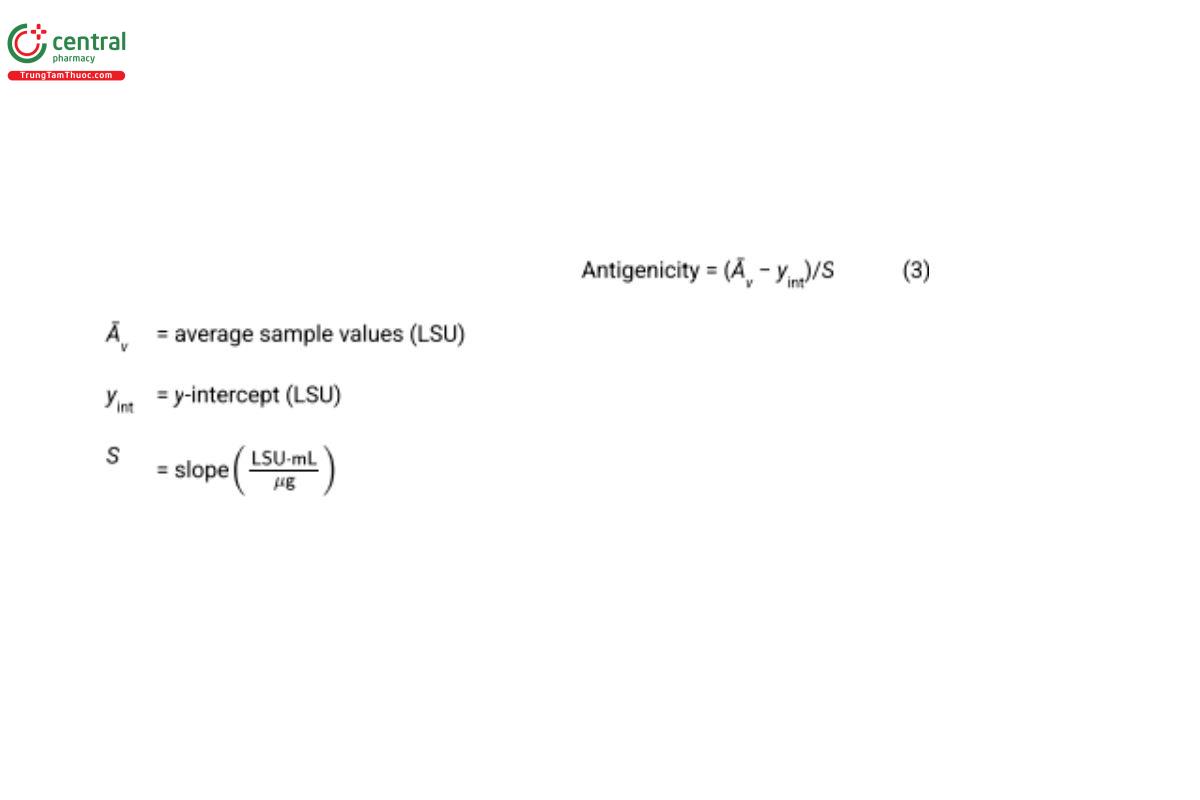
Acceptance criteria for replicate measurements of standards and samples should be established to ensure accuracy and precision.
8 8. ADDITIONAL SOURCES OF INFORMATION
Molina-Bolívar JA, Galisteo-Gonzáles F. Latex immunoagglutination assays. *Journal of Macromolecular Science Part C—Polymer Reviews*. 2005;45:59–98.
MacNair JE, Desai T, Teyral J, Abeygunawardana C, Hennessey JP. Alignment of absolute and relative molecular size specifications for a polyvalent pneumococcal polysaccharide vaccine (PNEUMOVAX23). *Biologicals*. 2005;33:49–58.
United States Environmental Protection Agency. Method 180.1: Determination of Turbidity by Nephelometry.
Lee CJ. Quality control of polyvalent pneumococcal polysaccharide-protein conjugate vaccine by nephelometry. *Biologicals*. 2002;30(2):97–103.
Whicher JT, Blow C. Formulation of optimal conditions for an immunonephelometric assay. *Ann Clin Biochem*. 1980;17(4):170–177.
Marrack JR, Richards CB. Light-scattering studies of the formation of aggregates in mixtures of antigen and antibody. *Immunology*. 1971;20(6):1019–1040.
Parisi M, Chianese A. The Use of Nephelometric Measurements in Crystallization Operations. *Chemical Engineering Transactions*. 2013;32:2065–2070.
Sternberg JC. A rate nephelometer for measuring specific proteins by immunoprecipitation reactions. *Clin Chem*. 1977;23(8):1456–1464.
Price CP, Spencer K, Whicher J. Light-scattering immunoassay of specific proteins: a review. *Ann Clin Biochem*. 1983;20(1):1–14.
Patent US4157871 System For Rate Immunonephelometric Analysis.
Patent US4204837 Method Of Rate Immunonephelometric Analysis.
Patent US4268171 Method Determining Concentration In Rate Nephelometric Immunochemical Analysis. (USP 1-Dec-2020)
