ANALYTICAL METHODOLOGIES BASED ON SCATTERING PHENOMENA—ELECTROPHORETIC LIGHT SCATTERING (DETERMINATION OF ZETA POTENTIAL)
If you find any inaccurate information, please let us know by providing your feedback here

Tóm tắt nội dung
This article is compiled based on the United States Pharmacopeia (USP) – 2025 Edition
Issued and maintained by the United States Pharmacopeial Convention (USP)
1 INTRODUCTION
Zeta potential is a parameter that is primarily used to characterize the stability of suspensions and emulsions. It can also be used to study surface morphology and adsorption on particles and other surfaces in contact with a liquid. Zeta potential is indirectly determined by the appropriate theoretical models from experimentally determined parameters, such as electrophoretic mobility. Electrophoretic light scattering (ELS) is the most general and common way to determine zeta potential of colloidal systems.
2 THEORY
A suspension of particles that has a given electrokinetic charge is placed in a cell that has a pair of electrodes placed apart at a known distance. A potential of known strength is generated between the electrodes and, by electrophoresis, results in the particles migrating toward the electrode of opposite charge. To detect and quantify this migration, particles are illuminated by a laser and the Doppler shifts of the scattered light from particles are recorded. The difference between the frequencies of the incident light and the scattered light is used to determine the velocity and direction of the particle migration. The particle velocity is then used to calculate the electrophoretic mobility by taking into account the strength of the electric field. Then, taking into account the viscosity and permittivity of the base liquid, the electrophoretic mobility is used to calculate the zeta potential.
3 INSTRUMENTATION
ELS zeta potential instruments are light-scattering instruments that have either a reference beam optics alignment (most common) or a cross-beam optics alignment (less common). An example of a typical small-angle, light-scattering, zeta potential instrument (from ISO 13099-2:2012¹) is shown in Figure 1.
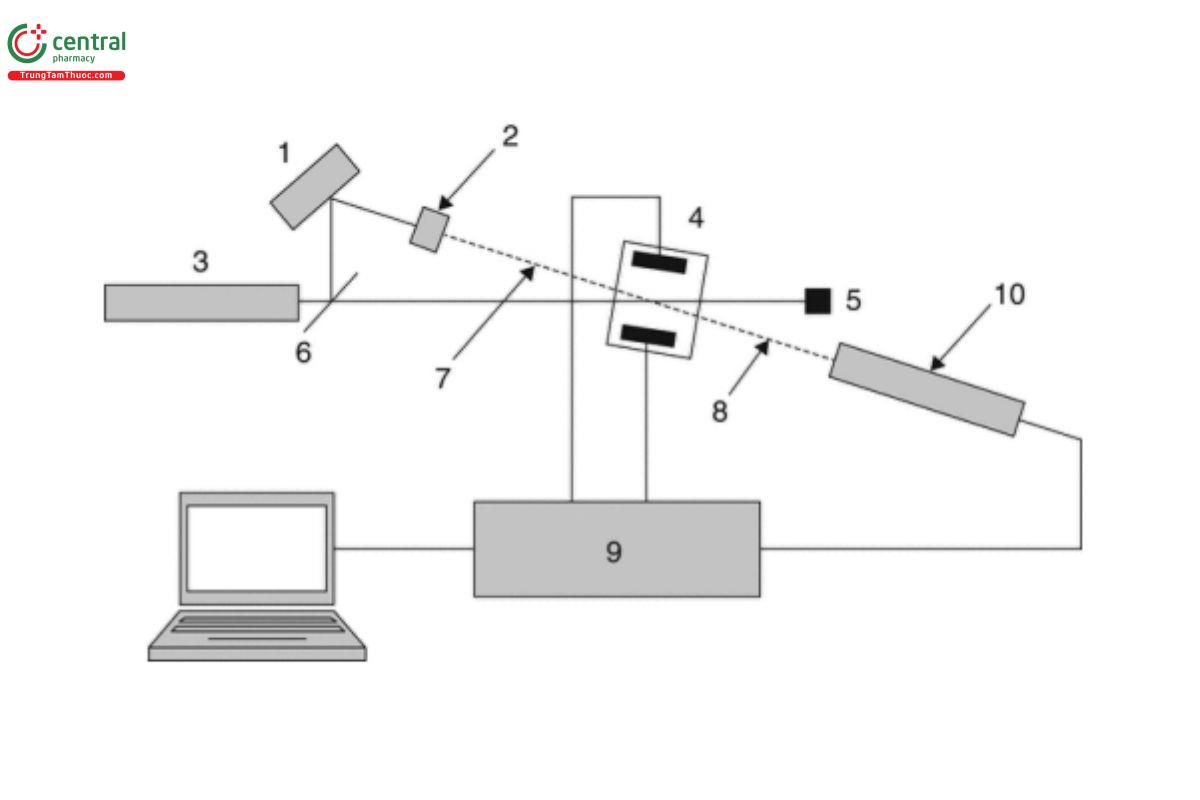
Key
Optical modulator
Attenuator
Laser
Sample cell with electrodes
Beam stop
Beam splitter
Reference beam
Scattered or reference light
Processor
Photoelectric detector
The cross-beam optical alignment instruments differ from the reference beam instruments in the fact that the laser beam is split into two beams of equal intensity that cross symmetrically (at a fixed angle between them) enter the sample cell from the same side.
A typical zeta potential measurement instrument is comprised of the following components:
A sample cell to contain the test suspension between two electrodes so that an electric field can be applied.
A suitable laser to illuminate the particles within the sample.
A suitable detector to capture the scattered light and the frequency shifts in the scattered light when the electric field is applied.
A software and computer system to process the collected scattering data and compute the mobility and zeta potential using appropriate models and algorithms.
The primary experimental technique used to determine zeta potential of colloidal systems is ELS. In this technique, a suspension is placed between two electrodes and an electric field is generated causing the ions and charged particles to migrate toward the oppositely charged electrode. When a laser is focused on the sample, this migration causes a Doppler shift in the frequency of the light scattered by the solution. An intensity or spectrum analysis of the shift in frequency is used to determine the electrophoretic mobility of the particles. Electroosmosis, the migration of the liquid along the sides of the cell flowing in the opposite direction from the particle migration, may affect the electrophoretic mobility measurement. A mechanism to correct for electroosmosis is often used during the measurement.
In cases where the Doppler shift is very small, the frequency analysis may not have enough resolution to determine the change. In such cases, phase analysis light scattering-based systems (PALS) can be used to perform the phase analysis of the shift. A typical schematic example of a PALS-based instrument is shown in Figure 2.
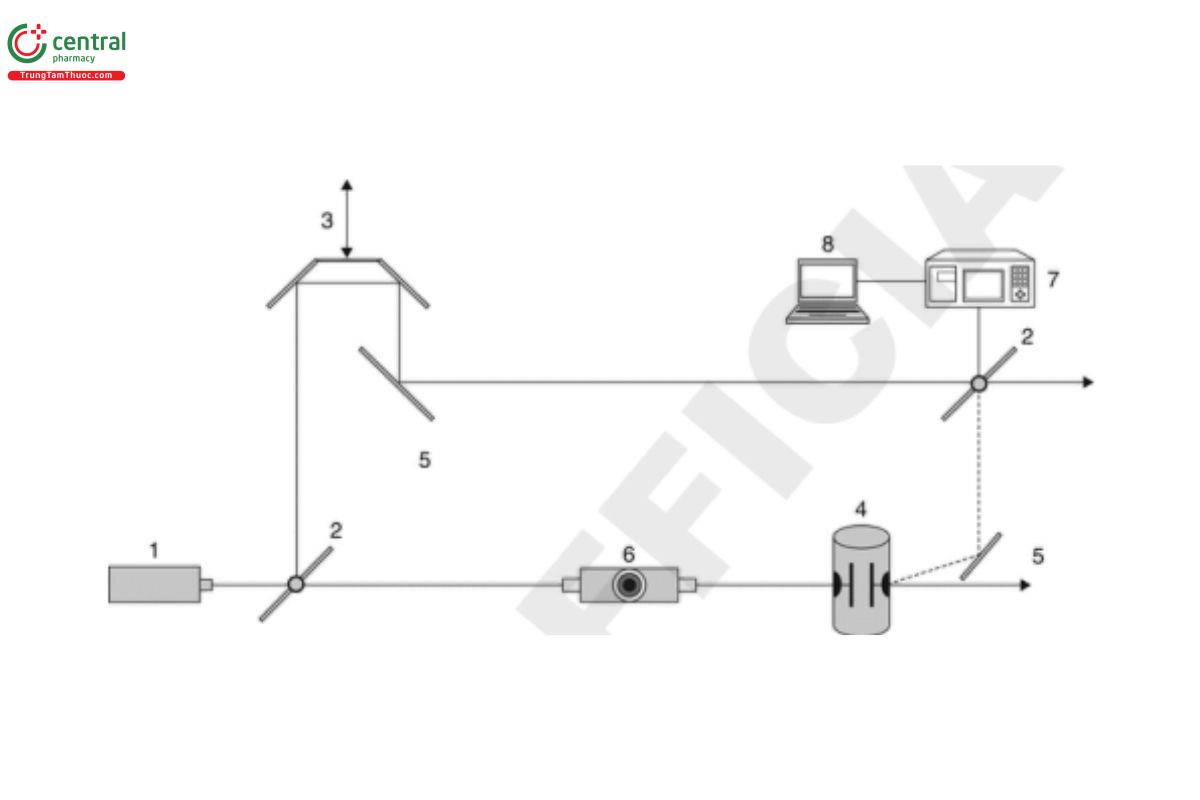
Key
Laser
Beam splitter
Pair of mirrors
Sample cell with electrodes
Mirror
Variable attenuator
Scattering detector
Computer
The primary advantage of PALS is that it has higher resolution and can therefore detect very small Doppler shifts. This is typically needed for suspensions in nonpolar solvents or in aqueous solvents of high ionic strength in order to reduce Joule heating of the electrode surface. Elevated temperatures can cause changes in solution viscosity, which convolutes the measurement. Additionally, sample degradation can occur in some cases. The reported result from PALS is only the mean value of electrophoretic mobility. It does not provide any distribution information. Some current implementations combine PALS and spectrum analysis to obtain distribution information.
4 APPLICATIONS
In general, ELS is used to characterize the charge distribution (or average charge) and stability of suspensions and emulsions. ELS has been used widely for characterizing colloidal systems where it is important to control their stability (e.g., flocculation of submicron materials suspended in a liquid). Examples include preparations of pharmaceutical suspensions and emulsions where flocculation could affect appearance, efficacy, and bioavailability. In biological applications and in the biotechnology industry, ELS was used early on to characterize the surface properties of cells. More recently, the biopharmaceutical industry has adopted ELS measurements during development of formulations for the evaluation of degradation pathways and the characterization of compositional variants.
5 DATA ANALYSIS
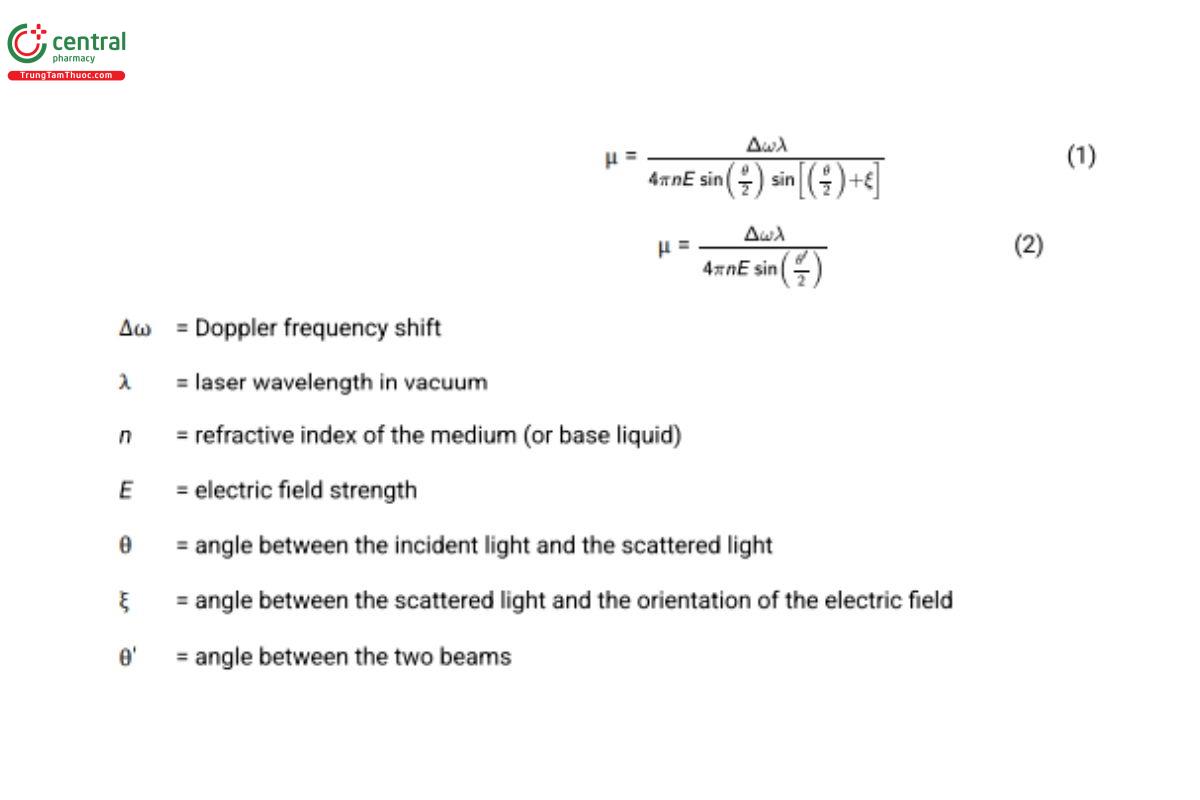
5.1 Calculation of Electrophoretic Mobility
The ELS method is used to determine the electrophoretic mobility (μ) by measurement of the Doppler frequency shift (Δω) of the scattered light in an applied electric field (E) using either Equation 1 (for the reference beam optical alignment) or Equation 2 (for the cross-beam optical alignment):
5.2 Calculation of Zeta Potential
For non-conductive spheres, zeta potential (ζ) is commonly calculated using an extension of the Henry equation for its relationship with electrophoretic mobility (μ) (Equation 3).
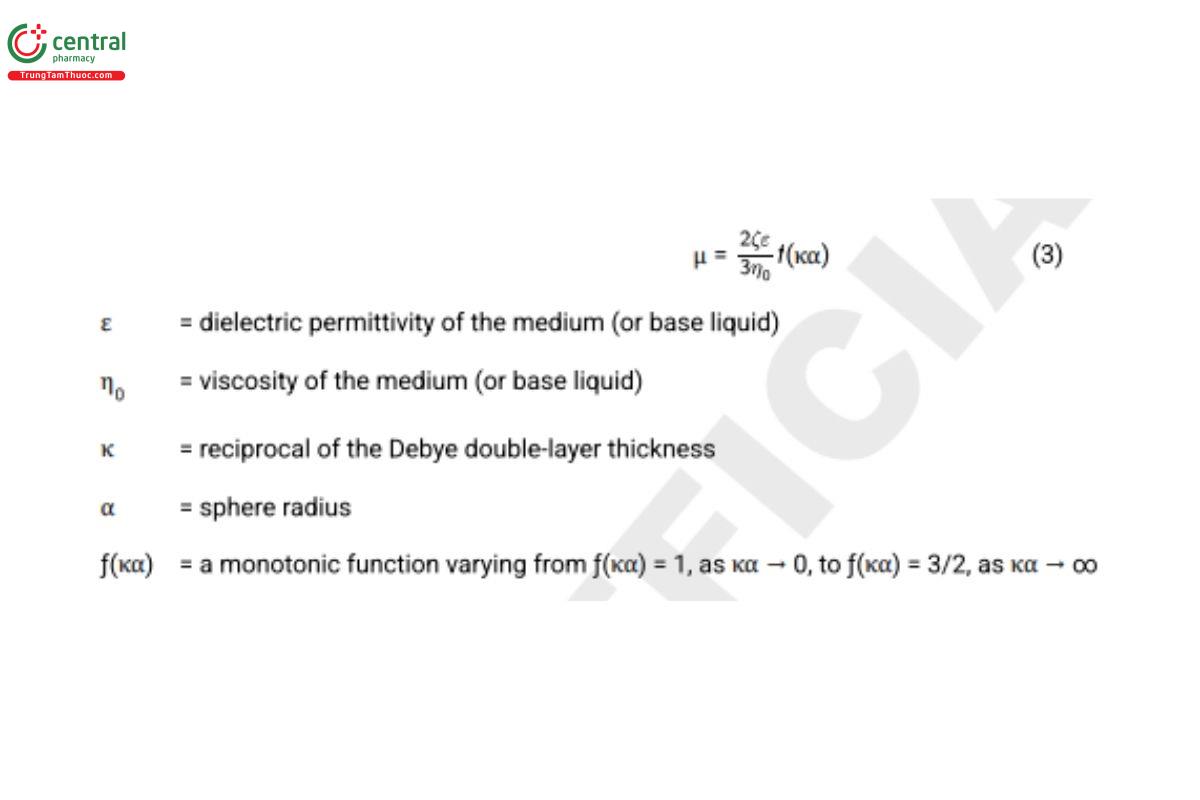
When κα >> 1, typical for large particles in aqueous suspensions, ƒ(κα) = 3/2 in the above formula, leading to the Smoluchowski equation (Equation 4).
When κα << 1, typical for small particles in organic liquids, ƒ(κα) = 1 in the above formula, leading to the Hückel equation (Equation 5).
Thus, depending on the nature of the particles and suspending medium, zeta potential (ζ) is calculated from the electrophoretic mobility (μ) utilizing either the Smoluchowski equation (Equation 4) or the Hückel equation (Equation 5).
The Smoluchowski equation is used when large solute particles (the hydrodynamic radius is large compared to the thickness of the electrical double layer) are probed, whereas the Hückel equation is preferred when small solute particles (the hydrodynamic radius is small compared to the thickness of the electrical double layer) are probed.
6 DATA INTERPRETATION
Zeta potential, expressed in units of millivolts (mV), is primarily used to characterize the physical stability of a suspension/emulsion. An unstable suspension may result in flocculation and sedimentation, and an unstable emulsion may collapse and result in phase separation. In general, as the absolute value of zeta potential decreases in magnitude, the suspension may become less stable and vice versa. The stability evaluation must be performed in conjunction with other relevant techniques. Although the relative stability change of the suspension may be indicated by changes in the value of the zeta potential, there is no direct link between zeta potential and absolute stability. Moreover, multiple determinations of different lots or preparations may be necessary to make general conclusions regarding the stability of different suspensions.
Although zeta potential is commonly used to quantitatively characterize the stability of a suspension, it is not intended to be the sole indicator of stability. Typically, zeta potential data are coupled with other quantitative or qualitative characterization techniques to monitor and characterize suspension stability, such as monitoring appearance or turbidity over time.
Zeta potential is also relative to the composition of the suspension. Typically, there is no distinct value of zeta potential that can be used as a threshold of stability.
It is important to note that zeta potential is a characteristic of a suspension, and not just of the particles. This includes the particles and the surrounding liquid environment with any ions or chemicals present in equilibrium. If care is not taken, performing multiple dilutions may alter this environment and change the zeta potential. It is also important to note that since the measurement relies on the migration of particles in an electric field, performing repeat measurements (NMT 3–5 depending on the sample) on the same aliquot may cause a shift in the zeta potential. If significant change is observed, an orthogonal method may be used to verify the integrity of the sample. Also note that a change of the zeta potential of a suspension may also change the observed hydrodynamic particle diameter by dynamic light scattering.
7 ADDITIONAL SOURCES OF INFORMATION
International Organization for Standardization. ISO 13099-2:2012: Colloidal systems—Methods for zeta potential determination—Part 2: Optical methods.
Xu R. Electrophoretic light scattering—zeta potential measurement. In: Xu R, ed. Particle Characterization: Light Scattering Methods. New York, NY: Kluwer Academic Publishers; 2002:289–343.▲ (USP 1-Dec-2019)
1 ©ISO. This material is reproduced from ISO 13099-2:2012 with permission of the American National Standards Institute (ANSI) on behalf of the International Organization for Standardization. The complete standard can be purchased from ANSI at webstore.ansi.org. All rights reserved.
