ANALYTICAL METHODOLOGIES BASED ON SCATTERING PHENOMENA—DYNAMIC LIGHT SCATTERING
If you find any inaccurate information, please let us know by providing your feedback here

Tóm tắt nội dung
This article is compiled based on the United States Pharmacopeia (USP) – 2025 Edition
Issued and maintained by the United States Pharmacopeial Convention (USP)
1 1. INTRODUCTION
Dynamic light scattering (DLS)—also referred to as quasi-elastic light scattering (QELS)—is a nondestructive, light-scattering technique for particle characterization of colloidal dispersions, biological solutions, and solutions of macromolecules. DLS has also been referred to in the literature as photon correlation spectroscopy (PCS), which is one of the DLS measurement methods such as frequency analysis and cross-correlation spectroscopy. It is often used for measuring average particle diameter and the broadness of the size distribution of submicron-sized particles that are dispersed in a liquid and are free from the influence of sedimentation. Compared to other light-scattering techniques, DLS can provide size information in the nanometer (nm) range, which is out of the primary range of static light scattering (e.g., laser diffraction). In addition, DLS can also provide information on the stability of suspensions/emulsions as it is highly sensitive to aggregation and to the behavior of suspensions/emulsions under different dispersing conditions.
2 2. APPLICATIONS
Typical applications for particle sizing by DLS include those measuring any particle dispersed in a liquid (suspensions or emulsions) that is influenced by Brownian motion. These applications include, but are not limited to:
Measuring micronized water insoluble active pharmaceutical ingredients (APIs) for injectable, oral, or other use
Measuring droplet size of oil in water emulsions where the API is dissolved in the oil
Monitoring liposome formation to ensure a desired size is attained
Monitoring the quality and uniformity of a suspension used in a coating process, such as time-release coatings
Monitoring the size of macromolecules, such as proteins or protein conjugates
Any additional step in a process or finished product where a suspension is used
3 3. THEORY
The application of DLS applies the concept of random motion of particles in a colloidal system, commonly referred to as Brownian motion, in the particle size measurement. Dispersed particles scatter incident light proportional to the radii and inversely proportional to the light wavelength, indicating that the large particles scatter much more light than the small particles, and the short wavelength light is scattered stronger than the long wavelength light from the same particle. If the diameter of the particle is less than 1/10th of the wavelength of the incident light, the scattering is commonly referred to as Rayleigh scattering. However, if the particles are greater than 1/10th of the wavelength of the incident light, then the scattering process can be described by the Mie theory. In that case, the scattering is angle dependent and the scattered light is more intensely concentrated toward the direction of the incident light.
As the particles scatter light in DLS, the time-dependent fluctuations of the intensity of the scattered light resulting from random motion of the particles is measured. The fluctuations of intensity in scattered light are correlated with short decay intervals (τ). One of the approaches to mathematically describe the time variation of such a random motion is the application of the correlation function. For monodisperse systems, the intensity autocorrelation function (ACF) is expressed as a mono-exponential function [G(τ)] as shown in Equation 1:
G(τ) = 1 + b e^(−2Dq²τ) (1)
where b is a constant, depending upon the instrument and settings of optics; D is the translational diffusion coefficient; and q is the scattering vector.
The scattering vector is further expressed as shown in Equation 2:
|q| = 4πn / λ · sin(θ/2) (2)
where n is the refractive index (RI) of the medium, λ is the light wavelength in a vacuum, and θ is the scattering angle.
The intensity autocorrelation function [G₂(τ)], often expressed as G₂(τ), is expressed as a function of the field correlation function, G₁(τ), as shown in Equation 3:
G₂(τ) = 1 + G₁(τ)² (3)
In DLS, a correlation is generated where raw correlation function (RCF) is plotted against delay time (τ) as shown in Equation 4:
RCF = G₂(τ) − 1 = G₁(τ)² (4)
D is calculated by data analysis of the autocorrelation function using Equation 1.
The diffusion coefficient (D) is then related to the radius (R) of the particles by means of the Stokes–Einstein equation as shown in Equation 5:
D = kᴮT / 6πηR (5)
where kᴮ is the Boltzmann constant, T is the absolute temperature, and η is the viscosity of the dispersion medium. The size of spherical particles is calculated from the Stokes–Einstein equation if the viscosity of the medium is known at a given temperature. As can be seen from Equation 5, temperature is an important factor impacting the diffusion coefficient both directly (T in the numerator) and indirectly as viscosity (η in the denominator) is an inverse function of temperature. The particle size determined by DLS is the apparent hydrodynamic radius, R(app), and can change with the particle concentration (c) as shown in Equation 6, where D(c) indicates that the measured diffusion coefficient is a function of c:
R(app) = kᴮT / 6πηD(c) (6)
3.1 Correlation Function Analysis
Intensity correlation functions are commonly normalized so that G(∞) equals 1. Normalization of autocorrelation coefficient results in a baseline limit of 1 for G(∞) for monochromatic light, with an upper correlation limit of 2 for G(0).
The time dependence of the fluctuation intensity is typically evaluated by employing a digital correlator. Each data point in the measured intensity correlation function is the average of the multiples of the number of photons counted in one sampling time and another sampling time with an interval between these two sample times called delay time. The entire intensity correlation function is formed by varying the delay time. Correlation is high at short delay times, and, as particles diffuse over time, correlation reduces to 0. The exponential decay of the correlation function is a characteristic feature of the diffusion coefficient.
The z-averaged decay rate (Γ) and the polydispersity index (PI) are commonly obtained by fitting a polynomial of third degree to the logarithm of the intensity correlation function per the cumulant method.
The decay rate is directly related to the diffusion coefficient (D) as shown in Equation 7:
Γ = q²D (7)
where q is the modulus of the scattering vector.
The cumulant analysis determines the mean diameter and a distribution width only. For polydisperse samples, more complex methods such as the CONTIN method are required in order to determine the size distribution function. Modern dynamic light scattering instruments perform cumulant analysis and size distribution function analysis automatically. The quality of the result, however, depends significantly on the quality of the data and the constraint settings of the fitting procedure.
The area under each peak of the intensity particle size distribution is proportional to the relative scattering intensity of each group of particles. The scattering intensity is weighted by molecular weight and radius; thus, the intensity distribution is more skewed toward the larger particles. Therefore, a change of the intensity to a mass or volume distribution can be achieved by means of the Mie theory. The underlying assumptions are as follows:
1. All particles exhibit an equal and uniform density.
2. The particles are spherical.
3. No inaccuracy exists in the intensity particle size distribution.
Although the first two assumptions can be applicable, the third assumption is not accurate due to the ineffective correlogram fitting in the DLS method, indicating that, no matter how monodisperse a sample is, the particle size distribution as measured by the DLS method will have intrinsic polydispersity and will not have a single band distribution.
Historically DLS studies were usually performed at an angle of 90°, which required very dilute samples to avoid multiple scattering phenomena and to have enough scattering intensity. With current instruments, it is now possible to perform DLS measurement on higher concentrated samples, up to 40% (w/v), with the advancement of backscatter technology.
The DLS technique provides size and polydispersity information at relatively low to moderate concentrations. At a high concentration DLS measurements become more challenging. These issues have been resolved to a great extent by the recent advancements in DLS backscattering and 3-D cross-correlation. Backscattering measurements allow detection of scattered light at a higher angle (typically 160°–180°), which is measured close to the cuvette wall. In 3-D cross-correlation technology, the sample is analyzed by two detectors simultaneously at the same scattering vector. Such measurements allow cross-correlating the signals from both detectors and, thereby, suppressing the contribution of multiple scattering.
Dynamic light scattering is typically used for measurements in the submicron range, although this technology may measure particle size up to a few microns. The upper size limit of DLS depends on sample density, implying that the upper limit of measurement is the point where the sedimentation of the particles overcomes the diffusion process. The lower limit of particle size measurement depends on the excess scattered light produced by the scattering particles relative to that produced by the suspension medium. In addition, sample concentration, relative RI of the particle and medium, laser power and wavelength of light, and detector configuration will affect the lower size limit measured by DLS. The major advantages of this method include its nondestructive nature, small amount of sample requirement, and ease of sample preparation. The accuracy of results determined by DLS may be compromised by sample contamination during the sample preparation. In addition, air bubbles and silicone droplets may be erroneously regarded as particles, leading to inaccurate results.
Measurements of nonspherical particles can also be a challenge for DLS and may lead to inaccurate estimates since DLS assumes that particles are spherical and the diffusion is only translational. Nonspherical particles, especially very large and dissymmetrical (rod-like shape) ones, have also a rotational diffusion component in addition to the translational one. The rotational diffusion component introduces a time-dependent anisotropic effect to the measured fluctuations of the scattered light, which results in inaccurate size estimates. Lastly, the accuracy of the results of DLS measurements is affected also by changes in temperature and viscosity of samples.
4 4. INSTRUMENTATION
The instrumentation generally comprises a laser as the light source, sample holder or cell, suitable optics, detector, correlator or spectrum analyzer, and a computation unit. Several configurations of signal detection and analysis are possible (see Figure 1).
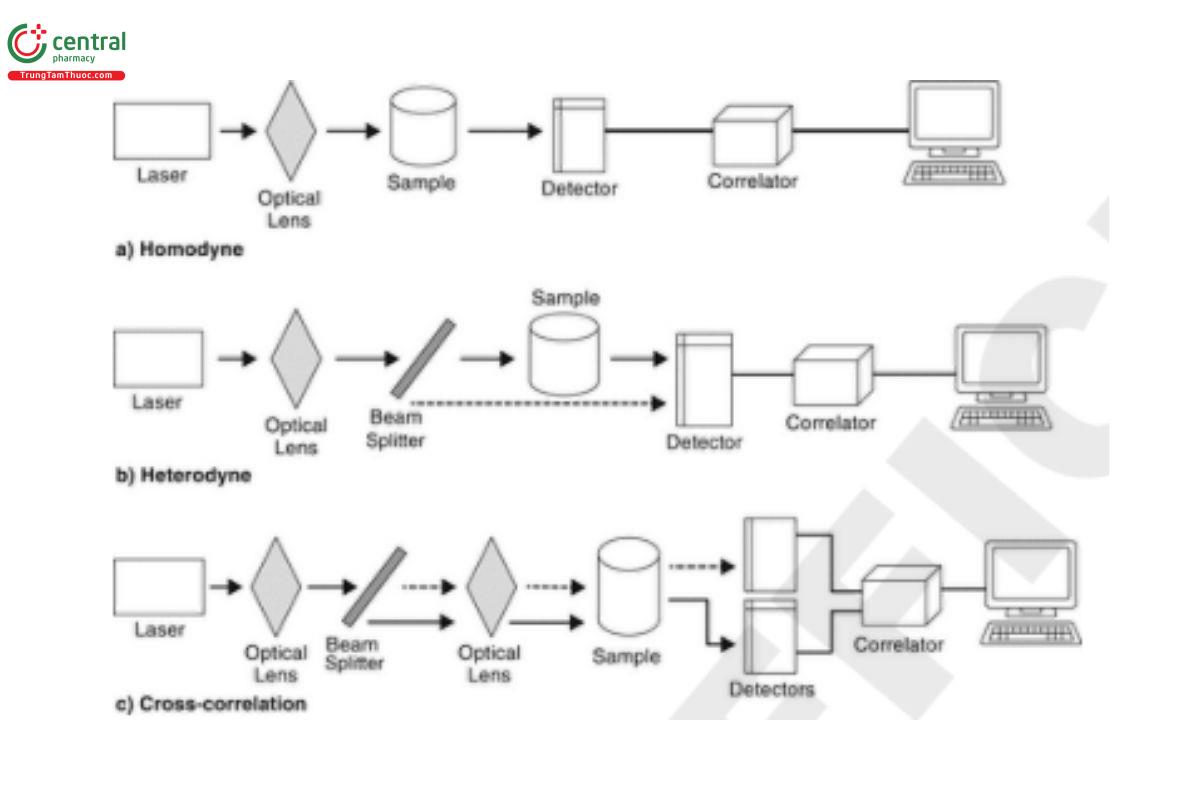
Homodyne detection uses only the light scattered from the incident beam. In heterodyne detection, a portion of the incident beam is mixed with the scattered light as a reference. A cross-correlation arrangement involves the combination of two simultaneous homodyne measurements.
A laser light source provides a monochromatic, coherent light source to illuminate the sample. The laser is generally polarized with the electric field component perpendicular to the plane of the incident and scattered light paths, usually vertically.
The sample is contained in a holder or cell, which must be capable of maintaining the temperature of the sample to within ±0.3°.
Optics focus the beam to define the measurement region and collect the scattered light for analysis. These may be external to the sample cell or, with fiber optics, may be inserted into the sample dispersion. A polarizing analyzer may be included to maximize transmission of the vertically polarized light.
Scattered light collected by the optics is measured by a detector capable of responding to the temporal fluctuations of the light intensity and providing an output proportional to the intensity. The detector is positioned at a fixed angle relative to the incident light, generally between 90° and 180° (side scattering and backscattering). Some instruments that include the optics to perform zeta potential determination allow for size to be determined by DLS using a forward-scattering angle, such as 10°–15°.
The time-dependent signal from the detector is processed by the correlator or spectrum analyzer. Further computations are then carried out to determine the results: the average hydrodynamic diameter and the PI or the particle size distribution depending on the analysis methods used.
Further details about the recommended instrumentation and possible configurations may be found in ISO 22412:2017—Particle size analysis—Dynamic light scattering (DLS) or in Particle Size Analysis by Dynamic Light Scattering 〈430〉.¹
As the measurement depends on first principles, including knowledge about the suspending fluid, there is no calibration required. However, proper instrument function should be confirmed periodically using suitably characterized standard particles. Standards may be available from the instrument vendors or from a national standards organization such as the National Institute of Standards and Technology. Requirements for the instrument suitability are specified in 〈430〉.
5 5. MEASUREMENT
5.1 Factors That Affect the Measurement
Concentration: The concentration must be sufficiently high to maintain constant time-averaged intensity but at the same time very low to prevent multiple scattering and/or particle–particle interaction.
Measurement duration: The typical measurement time is from 1–10 min.
Multiple scattering: At high concentrations, scattered photons may undergo multiple scattering, which results in a correlation function that decays faster and results in an apparent smaller particle size. Therefore, sample concentrations should be low enough that the optical paths remain to avoid multiple scattering.
Particle–particle interaction: In order to obtain an accurate measurement, the signal from all scattering particles freely experiencing Brownian motion within the scattering volume need to be measured. However, it may be difficult to always ensure the above requirement since at certain concentrations a portion of the scattering particles may be subjected to a constrained Brownian motion.
Sample preparation: It is absolutely critical to avoid large particles, commonly called “dust”, to avoid inaccurate signals and erroneous particle size measurements.
Size range: The size range commonly determined by DLS is 2–2000 nm. The instrument optics and engineering determine the lower size limit, while the upper limit is determined by the sedimentation and number fluctuations due to the limited number of large particles in a small scattering volume.
Stray light: Stray light must be minimized under all conditions.
Temperature and Viscosity: Temperature and viscosity of the sample must be controlled within a certain range in order to have an accurate measurement and reliable results.
5.2 Sample Preparation
As DLS monitors the intensity fluctuations in the light scattered from the sample due to the Brownian motion observed, different liquid environment conditions will affect the observed particle size. The conditions include: pH, conductivity, surfactants, or other chemicals or materials dissolved in the base liquid. This is why size data from DLS will differ from microscopic images taken with scanning electron microscopy or transmission electron microscopy. Microscopic characterization of nanomaterials involves drying the sample and placing it under vacuum while DLS requires the material to be dispersed in a liquid. DLS will give information on how the nanomaterial will behave in a liquid and report this behavior in terms of size.
It is best practice to analyze a sample suspension that is as close as possible to the concentration and conditions where the suspension will be used. In cases where the sample may be too concentrated, it is important to
1. perform dilutions with the same base liquid and
2. perform the dilution by mass.
The solvents/buffers used as base liquid must be properly filtered. This will ensure that the DLS results are repeatable and that the data from any subsequent samples analyzed will be comparable. If the dilution is not performed in this manner or is performed differently each time, the results may become unreliable.
5.3 Test Procedures
The test procedures in a typical DLS instrument take into consideration the following aspects:
1. Type of cell/cuvette: Typically plastic or glass. (Quartz is not necessary unless specified by the manufacturer and is reserved for work in the ultraviolet light range, whereas most DLS instruments operate in the visible light range.)
2. Temperature setting: Typically controlled by a Peltier thermoelectric controller.
3. Equilibration time: If the sample is not at room temperature prior to analysis or if the temperature setting is set higher or lower than room temperature, it is important to allow the suspension temperature to equilibrate.
4. Accumulation time: The number of accumulations represents the number of individual measurements of the light fluctuations to build the ACF. Increasing the number of accumulations increases resolution and quality of the ACF, while decreasing the number of accumulations decreases analysis time. Most manufacturers have a recommended accumulation time that is a balance of resolution and analysis time.
5. Selection of base liquid: This is the base liquid with no particles present. In most cases, this is simply water. It is not necessary to add pH or salt concentration information since these characteristics are considered additives or conditions of the water that will have a negligible effect on viscosity and RI.
6. Sample ionic strength optimization: To obtain a particle diameter close to its real dimension the PCS measurement has to be performed at a suitable ionic strength supplied by the presence of sufficient electrolyte (e.g., by a monovalent salt). A conductivity of greater than 1 millisiemens/cm is generally recommended. The stability of the suspension has to be closely monitored during the ions' addition to avoid the colloidal system collapse when the measurement is performed.
7. Number of repetitions: This is the number of times to repeat the analysis on the different aliquot from the same sample.
Additional procedures, calculation algorithms, and other items can be added based on the availability of the features by the instrument manufacturer.
5.4 Data Interpretation
The primary size result reported by DLS is the average hydrodynamic diameter (cumulant average or z-average) and the polydispersity index (PI). The PI is a measure of the broadness of the size distribution. For monodispersed materials, these two values are sufficient to evaluate the size of the particles.
For polydisperse systems, it is possible to calculate a particle size distribution using a Laplace inversion of the ACF and distribution algorithms. In practice, the general acceptance criteria for a Laplace inversion is that the PI is less than 0.7. The typical size distribution algorithms available are CONTIN and non-negative least squares (NNLS). Other algorithms may be available from the instrument manufacturer. The primary output for the size distribution data is an intensity weighted distribution. Number and volume-weighted distributions can be calculated from the intensity distribution. However, converting to number distribution should be done with caution.
Due to the low resolution of DLS and the error from the mathematical conversion, the values of D₁₀, D₅₀, and D₉₀ should not be used to describe the distribution results.
6 6. ADVANTAGES AND LIMITATIONS
DLS gives size information in the nanometer range, which is difficult to achieve using some other particle analyzing techniques. DLS also gives information on the stability of a suspension as well as interactions with the liquid environment, as the size determined is the hydrodynamic diameter.
DLS is not a very high-resolution technique for broad size distributions. The presence of any larger particles will influence the size calculation at the smaller end of the distribution. In some cases, filtration of the aliquot under analysis may be needed to ensure aggregates, agglomerates, or large particles are removed.
The assumption is made that the particles in the suspension are only in Brownian motion and no other influences. If the particles are actively flocculating or settling, this motion can be detected and the instrumentation will assume that it is Brownian motion and give inconsistent results. This is why the upper size limit is dependent on the density of the particles and the viscosity of the liquid. It is not always correct to assume that using a higher viscosity liquid will limit settling and yield better results because this will also limit Brownian motion.
7 7. ADDITIONAL SOURCES OF INFORMATION
International Organization for Standardization. ISO 22412:2017: Particle size analysis—Dynamic light scattering (DLS).
Xu R. Photon correlation spectroscopy. In: Xu R, ed. Particle Characterization: Light Scattering Methods. New York, NY: Kluwer Academic Publishers; 2002:289–343.
Xu R. Shear plane and hydrodynamic diameter of microspheres in suspension. Langmuir. 1998;14(10):2593–2597.
Berne BJ, Pecora R. Dynamic Light Scattering With Applications to Chemistry, Biology, and Physics. Hoboken, NJ: John Wiley & Sons; 1976 (reprinted, Mineola, NY: Dover Publications, Inc.; 2000).
Pecora R, ed. Dynamic Light Scattering: Applications of Photon Correlation Spectroscopy. New York, NY: Plenum Publishing Corp.; 1985.▲ (USP 1-Dec-2020)
1 This chapter will be published in a future Pharmacopeial Forum (PF) issue.
